

Modeling the contribution of the microbial carbon pump to carbon sequestration in the South China Sea
Wenfang LU1,2,3,4, Yawei LUO1, Xiaohai YAN2,3 & Yuwu JIANG1,3*
1 State Key Laboratory of Marine Environmental Science, College of Ocean and Earth Sciences, Xiamen University, Xiamen 361102, China;
2 Center for Remote Sensing, College of Earth, Ocean and Environment, University of Delaware, Newark 19716, USA;
3 Joint Institute for Coastal Research and Management, Xiamen University, Xiamen 361102, China;
4 Key Laboratory of Spatial Data Mining and Information Sharing of Ministry of Education, National Engineering Research Centre of Geo- spatial Information Technology, Fuzhou University, Fuzhou 350116, China
Received October 17, 2017; revised November 3, 2017; accepted March 27, 2018; published online April 2, 2018
Abstract The two key mechanisms for biologically driven carbon sequestration in oceans are the biological pump (BP) and the microbial carbon pump (MCP); the latter is scarcely simulated and quantified in the China seas. In this study, we developed a coupled physical-ecosystem model with major MCP processes in the South China Sea (SCS). The model estimated a SCS- averaged MCP rate of 1.55 mg C m-2 d-1, with an MCP-to-BP ratio of 1:6.08 when considering the BP at a depth of 1000 m. Moreover, the ecosystem responses were projected in two representative global warming scenarios where the sea surface temperature increased by 2 and 4 C. The projection suggested a declined productivity associated with the increased near-surface stratification and decreased nutrient supply, which leads to a reduction in diatom biomass and consequently the suppression of the BP. However, the relative ratio of picophytoplankton increased, inducing a higher microbial activity and a nonlinear response of MCP to the increase in temperature. On average, the ratio of MCP-to-BP at a 1000-m depth increased to 1:5.95 with surface warming of 4 C, indicating the higher impact of MCP in future ocean carbon sequestration.
Keywords South China Sea, Microbial Carbon Pump, Global change, Numerical model
Citation: Lu W, Luo Y, Yan X, Jiang Y. 2018. Modeling the contribution of the microbial carbon pump to carbon sequestration in the South China Sea. Science China Earth Sciences, 61: 1594–1604, https://doi.org/10.1007/s11430-017-9180-y
1.Introduction
Ocean carbon sequestration is defined as the addition of in- organic or organic carbon to an oceanic reservoir that holds the capacity to accumulate and store carbon (IPCC, 2013). In the ocean, biological mechanisms for long-term carbon se- questration are not fully understood. Specifically, the two key mechanisms for biological carbon sequestration in the ocean are the biological pump (BP) (Chisholm, 2000) and the newly proposed microbial carbon pump (MCP) (Jiao et al., 2010, 2014a). The BP is a series of processes in which organic carbon is fixed from CO2 at the ocean’s surface and then vertically transported to the interior. Most of the organic carbon is converted to dissolved inorganic carbon, which is eventually ventilated to the surface again through the ther- mohaline circulation (Ducklow et al., 2001). While only a small fraction of the particulate organic carbon (POC) can escape from the mineralization processes and contribute to long-term storage and burial (Passow and Carlson, 2012), MCP involves a process in which a part of labile POC and dissolved organic carbon (DOC), utilized by marine het- erotrophic bacteria and archaea, can be efficiently trans- formed into recalcitrant dissolved organic carbon (RDOC) resistant to rapid biological degradation (Hansell, 2013).
This has been demonstrated by lab experiments and field observations (Gruber et al., 2006; Lechtenfeld et al., 2015; Ogawa et al., 2001). Considering the 624 Gt C inventory of oceanic RDOC (Hansell, 2013), which is comparable to the atmospheric CO2 reservoir (~750 Gt C), and the extremely long age of RDOC (4000–6000 years; Bauer et al., 1992), the MCP can be a vital mechanism with huge potential for car- bon sequestration. The estimated annual production of RDOC in the MCP of ~0.2 Pg C (Legendre et al., 2015) accounts for nearly 10% of the ocean uptake of atmospheric CO2 each year (2.5 Pg C yr-1 by Le Qu r et al. (2014)).
The production of RDOC interacts with the production ofPOC through complex interactions between the two pro- cesses (Jiao et al., 2014a). In addition, both processes have large spatial and temporal variations (Jiao et al., 2010). The sinking particles dissolve and are utilized by bacteria; this leads to production of RDOC and contribution to the MCP. The absorption of RDOC onto sinking particles can be re- garded a way that the MCP fuels the BP. Concretely, the relative rate of the BP and the MCP would have significant impacts on ocean carbon sequestration and consequently on the overall carbon cycle of the Earth system (Jiao et al., 2014a; Legendre et al., 2015).
Ecosystem modeling is a useful approach in quantifying the relative importance of the BP and MCP as well as in identifying key processes controlling the two mechanisms (Jiao et al., 2014a). While simulations of the BP have been quantitatively constructed upon well-accepted numerical models, modeling of the MCP is preliminary and hypothe- tical (Legendre et al., 2015). Therefore, although the BP has been extensively studied in the China seas (Liu and Chai, 2008; Liu et al., 2002; Ma et al., 2014), the MCP is still overlooked. Filling this knowledge gap is critical to allow for comparing the effects and responses of the two carbon se- questration mechanisms to the changing climate and in- creasing CO2 levels.
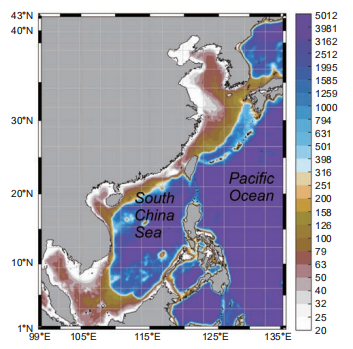
Figure 1. The model is driven with the atmospheric forcings obtained from the National Centers for Environmental Prediction (NCEP) Re- analysis data (Kalnay et al., 1996).
The South China Sea (SCS), shown below in Figure 1, is a large semi-enclosed marginal sea in the Western Pacific Ocean. The basin of the SCS can be as deep as 5000 m, surrounded by extensive continental shelves. While the coastal water supply of SCS is subjected to various river inputs (e.g., the Pearl River and the Mekong River), the in- terior water is typically oligotrophic year-round (Wong et al., 2007). This characteristic makes the SCS an ideal site to comparatively study the BP and MCP carbon sequestration under significant environment gradients.
Here, the model and experimental framework are first described in detail, particularly the MCP-related variables and processes, the configuration, and the experiments of the physical-ecosystem coupled model. Results are then pre- sented from the standard runs and the sea surface tempera-ture (SST) warming scenario project runs, with emphasis on comparing the BP and MCP rates and their relative con- tribution to the carbon sequestration. Finally, the physical and ecological factors controlling the spatiotemporal dis- tribution of the MCP rates are discussed.
2.Model and methods
2.1Physical-ecosystem coupled model
The physical model used in this study was adopted from the operational Taiwan Strait Nowcast/Forecast (TFOR) system (Jiang et al., 2011; Lin et al., 2016) widely applied in multi- purpose oceanic studies in the China seas (Liao et al., 2013; Lu et al., 2017, 2015; Wang et al., 2013), which is based on the Regional Ocean Model System (Shchepetkin and McWilliams, 2005). The 1/10 model domain covers the entire SCS as well as a substantial part of the open North- Western Pacific Ocean, as shown in
The ecosystem model used in this study was based on the Carbon, Silicon, Nitrogen Ecosystem (CoSINE) model (Xiu and Chai, 2014), which has been extensively applied in studying the primary productivity (Liu and Chai, 2008), phytoplankton community structure (Ma et al., 2013), and the impacts from mesoscale eddies (Guo et al., 2015) in the China seas. The CoSINE model includes 31 ecosystem variables, including four inorganic nutrients (nitrate, am- monium, silicate, and phosphate), three phytoplankton functional groups (picophytoplankton, diatoms, and cocco- lithophorids), two zooplankton classes (microzooplankton and mesozooplankton), four detritus pools (particulate or- ganic nitrogen, POC, particulate inorganic carbon, and bio- genic silica), four dissolved organic matter pools (labile (LDOM) and semi-labile (SDOM) for both carbon and ni- trate), and bacteria. Please refer to Lu et al.1) for the detailed model configuration and validation.
2.2MCP module
The CoSINE model was revised for this study by in- corporating an explicit RDOC pool and the MCP processes, shown in Figure 2. The magnitude of the MCP, termed PRDOC hereafter, is defined as the production rate of long-lived DOC components, i.e., RDOC (Legendre et al., 2015). Bacteria was suggested to be the major producer of ocean RDOC, which accounted for 25% of the ocean RDOC (Benner and Herndl, 2011; Lechtenfeld et al., 2015), while higher trophic levels had less contribution (Gruber et al., 2006). Other biotic or abiotic factors might also contribute to PRDOC. However, Osterholz et al. (2015) indicated that microbial communities alone were capable of producing DOC that are similar in reactivity and composition with the global ocean RDOC pool. Hence, the RDOC in the model is produced via two bacteria-related pathways: (1) direct exudation by bac- teria and (2) passive release from viral lysis of microbial cells. The additional POC degradation pathway (Jiao et al., 2010) is implicitly included by transforming from POC to labile/semi-labile organic carbon and then to RDOC via the two pathways. At the temporal scale shorter than a decade, the produced RDOC is considered to be non-degradable. The rate of RDOC production in the model was constrained to approximately ~0.04 M yr-1 using a bulk RDOC con- centration of 40 M (Hansell, 2013) and an average resident time of 1000 years for the RDOC pool. This resident time is shorter than the radiocarbon age of 4000–6000 years ob-
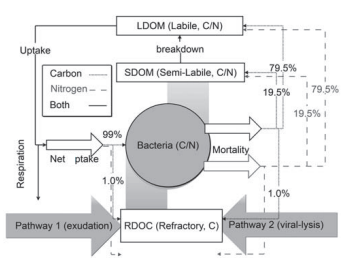
Figure 2 Schematic diagram of the MCP module
2.3 Numerical experiment
It has been speculated that even small perturbations, such as a one-degree increase in seawater temperature, could change the relative contribution to carbon sequestration via the BP versus the MCP (Jiao et al., 2014a). To test this hypothesis, two numerical experiments were designed to simulate sce- narios representative of the potential anthropogenic effect of global warming. Huang et al. (2014) analyzed the projected state of the SCS from 32 models from the Coupled Model Intercomparison Project Phase 5 project, showing the upper limits for the projected SST warming of 2.0 C for RCP4.5 and 4.0 C for RCP8.5 (representative concentration path- ways driven by additional radiative forcing of 4.5 and8.5 W m-2) by 2100 (Huang et al., 2014). To represent thetwo scenarios, the SST was nudged toward the SST of 2 and 4 C higher than the World Ocean Atlas (WOA) climatology, respectively, while the SST in the standard run was nudged toward WOA climatology. An additional net heat flux cor- rection term was included during time-stepping as below in eq. (1) (Barnier et al., 1995).

where, SST and SSTclim are the modeled and climatological SST, respectively, where the climatology can be replaced with the 2 or 4 C climatology; is the unadjusted NCEPnet heat flux; and is the sensitivity of net heat flux to SST as is prescribed by the Comprehensive Ocean-Atmo- sphere Data Set (Woodruff et al., 1987). Once below the surface, the warming will propagate downward through the subsurface ocean by physical diffusion and advection pro- cesses. The water temperature T controls the nutrient uptake process of phytoplanktons by multiplying an exponential function Tcontrol, defined in eq. (2), as a temperature-limiting factor (Xiu and Chai, 2014).

The experimental cases are referred to as ExpT2 and ExpT4 hereafter, representing the case of a rise in SST of 2 and 4 C, respectively.
3.Results
3.1Spatiotemporal variability of MCP and BP
Driven by the East Asian Monsoon and regional circulation, both observed and modeled integrated primary production (PP) in the SCS presented a significant seasonal contrast with spatial variation. The observed integrated PP is presented for summer and winter in Figure 3a and 3d, respectively, and the modeled integrated PP for summer and winter is found in Figure 3b and 3e, respectively. All vertical integration was conducted over the entire water column. In summer, high productivity appeared near the Vietnam coast, which was stimulated by intensive coastal upwelling and the jet se- paration, as shown in Figure 3a and 3b (observed and modeled, respectively). The observed gradient of high jet- influenced productivity to low central-water basin pro- ductivity was also reflected in the model. The observed summer blooms of the East Hainan Island and the Pearl River plume were also discernable in the model. The PP basin-wide was higher in winter than in summer owing to the enhanced surface mixing. In particular, the winter bloom northwest off the Luzon Island was significant, as shown in Figure 3d and 3e.
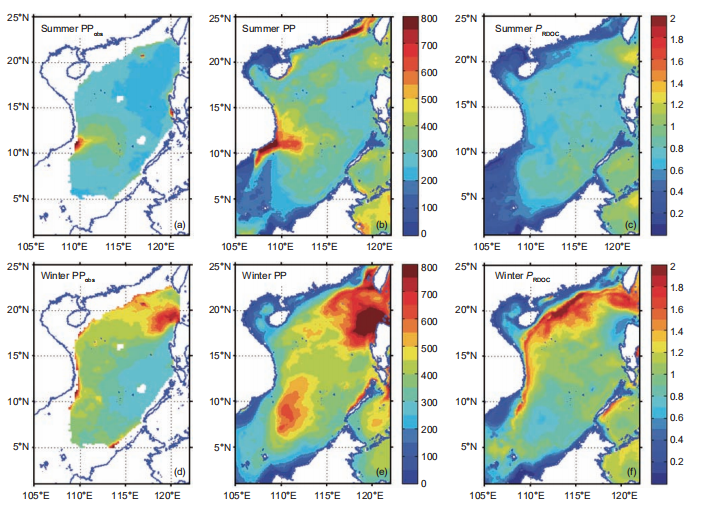
Figure 3 Satellite-based estimation of vertical-integrated net primary production (PPobs) in (a) summer and (d) winter; modeled primary production (PP) inb)summer and (e) winter; PRDOC for multiyear mean in (c) summer and (f) winter. All units are mg C m-2 d-1. The PPobs was derived via the standard chlorophyll-based Vertically Generalized Production Model algorithm (Behrenfeld and Falkowski, 1997) available at http://www.science.oregonstate.edu/ ocean.productivity/.

Figure 4 Surface 100 m integrated DOC (unit: mol m-2) in (a) summer and (c) winter; surface 100 m average BAC (unit: mmol C m-3) in (b) summer and(d)winter.
The surface 100 m integrated DOC inventory is shown for summer and winter in Figure 4a and 4c, respectively. Driven by physical and biological processes, this was higher when the intrusion of Kuroshio was stronger, and lower in intense upwelling regions. These results are consistent with the in situ observation by Wu et al. (2015). The surface 100 m bacteria concentration, shown for summer and winter in Figure 4b and 4d, respectively, therefore demonstrated sub- stantial spatiotemporal variability. Given the conversion factor of 10 fg C cell-1 for bacteria (Ducklow, 2000), the modeled bacteria concentration is roughly of the same order of magnitude with the observed bacteria abundance at 2 105 cell mL-1 (Jiao et al., 2014b). As a consequence, the PRDOC, shown for summer and winter in Figure 3c and 3f, respectively, was generally higher in winter than in summer. Interestingly, in some regions with high PP, e.g., the Vietnam coast in summer, or the winter bloom area off of Luzon Island, PRDOC was much lower than in the surrounding water. This could be explained by the phytoplankton community structure, which will be further discussed in Section 4.(June, 239 mg C m-2 d-1). Both satellite-derived and mod- eled PP presented substantial interannual variation that was modulated by the El Ni?o and Southern Oscillation varia- bility (Chai et al., 2009), while the observed signal was more pronounced. Our model provided an estimation of annual mean PP at 313 mg C m-2 d-1, comparable with previous studies (e.g.,354 mg Cm-2d-1 in Liu et al. (2002) and343.2 mg C m-2 d-1 in Ma et al. (2014)). In the model, the new production (NP) was defined as the production sup- ported by a new source of nitrogen, i.e., nitrate, while the regeneration production (RP) was the production supported by ammonium uptake (Ma et al., 2013). NP and RP sug- gested a similar seasonal cycle while the latter lagged for~1 month. The seasonal cycle of RP was somewhat flatter than that of NP, as shown in Figure 5. The f-ratio in the model was 0.49, higher than the modeled value of ~0.4 in Ma et al. (2014) and <0.47 observed in Chen (2005). Nevertheless, generally high f-ratio in SCS can be confirmed among stu- dies.
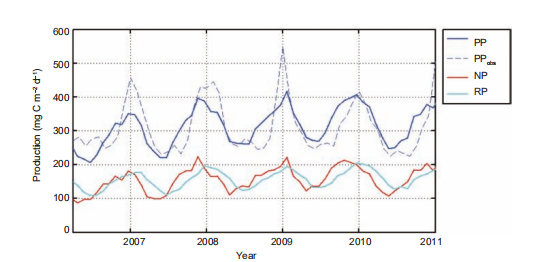
Figure 5 Time series of the SCS-averaged productions (unit: mg C m-2 d-1). PP, primary production; PPobs, satellite-based observation of PP; NP, new production; and RP, regenerated production. The model productions are vertically integrated to the bottom. The region with water depth shallower than 120 m was masked to remove the coastal overestimation of PPobs.
Although in many studies, the BP is quantified as the rate of sinking POC at a depth of approximately 100 m, it can be better represented as the sedimentation of POC out of the mesopelagic zone at depth of approximately 1000 m, as below this, the carbon can be stored for 100 years or more (Legendre et al., 2015; Passow and Carlson, 2012). Thus, in this study, we used the modeled organic carbon export at a depth of 1000 m as the indicator for BP (BP1k), considering the vertical velocity from the physical model with a constant 15 m d-1 sinking velocity.
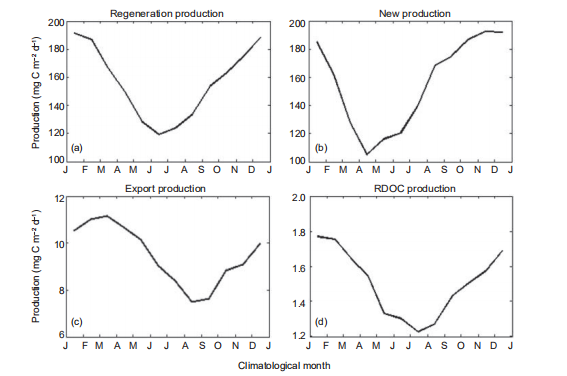
Figure 6 Multiyear-averaged seasonal production cycle in standard run (mg C m?2 d?1) for (a) regeneration production (RP), (b) new production (NP), (c) export production, and (d) RDOC production. J, January; F, February; M, March; A, April; M, May; J, June; J, July; A, August; S, September; O, October; N, November; D, December.
To further illustrate the seasonal cycle of the production in SCS, the mean seasonal cycles of the SCS-averaged RP, NP, PRDOC, and BP1k are shown in Figure 6. The magnitudes of RP and NP were higher during transition from winter to spring, consistent with previous simulations (Ma et al., 2014) and observations (Chou et al., 2005). Controlled by the bacteria production, PRDOC covaried with the RP, since the bacteria monopolized the remineralization process in the CoSINE model. Meanwhile, the intensity of bacteria activity con- trolled the production rate of RDOC (Ogawa et al., 2001). Conversely, the BP1k was high in spring and low in autumn. The correlation coefficient between BP1k and PP peaked near0.6 when lagged by 3 months, which can be interpreted as the approximate time for POC to sink from the surface to a depth of 1000 m at speed of 15 m d?1, set by the model. This in- terpretation was supported by investigating the time lag of, for instance, the export production at 2000 m (BP2k) with respect to PP. In this example, BP2k lagged PP for ~5 months, demonstrating the validity of this interpretation.
3.2 Results of warming experiments
On a climatological monthly basis, the changing rates in production (as percentages) in the warming experiments with respect to the standard run are presented in Figure 7 and Table 1. Due to the increased stratification and weaker en- trainment, the nutrient supply was suppressed, leading to an overall reduction in NP (?2.4%) and RP (?1.5%). These results are comparable with previous global projections, which gave estimations of a reduction of 2.1% PP under the RCP4.5 (Moore et al., 2013). The reduction indicated higher sensitivity in NP to global warming. The changing rates presented more significant seasonal variability in NP than that of RP. The reduction of RP was larger in summer and autumn than during the winter and spring, as shown in Figure7. The BP1k responded to the suppressed production with anall-year reduction, dominated by a considerable reduction in diatom production, as shown in Table 1. The multiyear mean decline rate of PRDOC was ?1.4%, while the value was ?1.5% for BP1k, leading to a slightly increased MCP-to-BP ratio. Interestingly, the PRDOC conversely increased during Marchand August, when the RP reduction was weak, implying that the warming condition favored MCP in some situations.
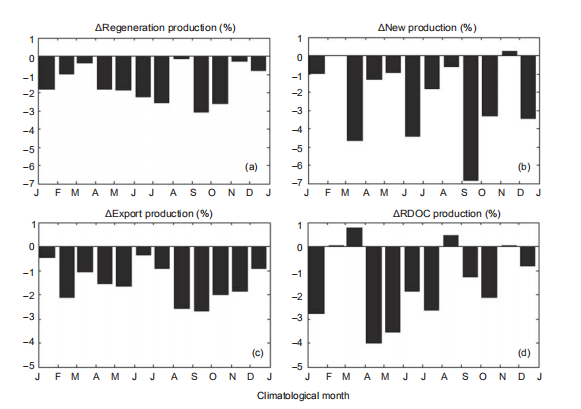
Figure 7 For ExpT2, changing percentages of (a) RP, (b) NP, (c) export production, and (d) RDOC production with respect to the standard run as a function of climatological month. J, January; F, February; M, March; A, April; M, May; J, June; J, July; A, August; S, September; O, October; N, November; D, December
The results of ExpT4 suggest that the ecosystem response could be disproportionate to surface warming. The decline in NP (?1.7% in ExpT4 vs. ?2.4% in ExpT2) and RP (?0.03% vs. ?1.5%) was partially compensated by increased produc- tion in some months, whereas the compensation in RP was more notable. This is displayed in Figure 8. The response of BP1k was consistent with ExpT2, while the signal was even stronger, suggesting that the BP could be more sensitive to surface warming. Since the RP and PRDOC were closely tied to microbial activity, the response in the two processes pre- sented similar seasonal character. As a consequence of higher declines in BP than PRDOC, the MCP-to-BP ratio in- creased to 1:5.95.
4.Discussion
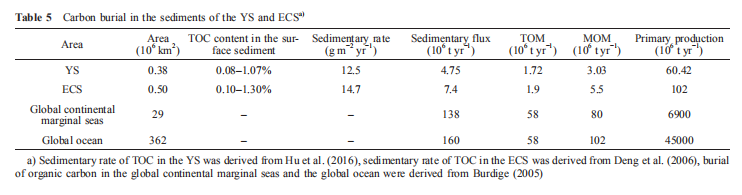
Globally, the rates of RDOC-based MCP (0.18–0.38 Pg C yr?1) and POC-based BP (0.43–0.66 Pg C yr?1) se-questrations were estimated roughly at the same order of magnitude (Jiao et al., 2014a; Legendre et al., 2015). Our regional simulation provided the average estimations of 1.55and 9.43 mg C m?2 d?1 for MCP and BP sequestration, re- spectively. This MCP rate corresponded to 0.5% of the net PP, which is close to the value of 0.4–0.6% in previous es-timates (Hansell, 2013). In short-term cultured experiments (~1 month), bacteria were able to rapidly produce RDOC in the amount of 3–5% carbon of initial labile substrate (Gruberet al., 2006). Although the timescale reported in the experi- ment was much shorter than in this study, the reported pro- duction rate could be considered as an upper limit of the carbon (MOM) according to the different origins. TOM in- cludes vegetal organic matter in modern time and aged soil organic carbon, while MOM is produced by primary pro- duction of marine phytoplankton. A summary of the data of recent research shows there is 1.72 106 t C yr?1 of TOM and 3.03 106 t C yr?1 of MOM depositing in the YS, whereas the TOM and MOM deposited in the ECS is 1.9 106 and 5.5 106 t C yr?1, respectively (Table 5). The distribution of TOM in the YS and ECS are controlled profoundly by riv- erine discharge and hydrological dynamics. The Changjiang River and the Yellow River are the most important sources of river discharge for the Chinese coastal seas, which discharge 1.0 109 and 4.8 108 t yr?1 of suspended sediment into the YS and the ECS, respectively (Milliman and Meade, 1983). Therefore, coastal seas near the Yellow River estuary, the Changjiang Estuary, and the Subei Shallow have high con- tents of TOM in their surface sediment. With increasing offshore distance, the inputting of TOM is reduced gradually, and the percentage of TOM in the sediment decreases si- multaneously. As for MOM in sediment, high content is usually found in the middle YS, the Changjiang Estuary and its adjacent area, and the Min-Zhe coastal region. These re- gions are normally provided a high level of phytoplankton primary production and serve as the main body for the burial of carbon in the YS and the ECS. A comparison study in- dicates the proportions of MOM in the sediment could ac- count for 5.0% and 5.4% of the phytoplankton primary production, which are obviously higher than the average value of the global ocean (Table 5). In particular, research conducted on sedimentary organic matter in coastal areas of the ECS indicates anthropogenic activities have played a critical role in the carbon burial of continental marginal seas during the past 100 years (Cao et al., 2017). The increase in nutrient supply caused by more intensive human activities (e. g., fertilization and sewage discharge), along with a strengthened KC and East Asian Winter Monsoon (EAWM), have led to an enhanced MOM contribution and increased sedimentary organic matter abundance in the ECS sediments over the past 100 years. In contrast, a significant reduction in TOM contribution is attributed to intensive dam construction following the 1960s. The aforementioned finding not only showed that large-scale human activities have affected thecarbon burial in continental shelf sediment, but also provided new insights for improving carbon storage in shelf seas.
5.Conclusion and prospects
Since the beginning of the 21st century, the contradiction between rapid development of human society and the limited earth environment has become gradually significant. The subsequent consequences of global change, such as global warming, melting glaciers, ocean acidification, sea-level rise, frequent extreme weather, thermohaline circulation weakening, and species extinction have threated the ecolo- gical safety of the natural environment and sustainable de- velopment of human society. Consequently, research regarding global change has become an important focus for scientists throughout the world. Among various projects re- garding global change, the biogeochemical cycling of carbon has always been the vital focus. Understanding the role of carbon in the global cycling of material and energy, and the related key controlling mechanisms, could show the inter- relationship between human activities and the natural en- vironment and help to establish an efficient solution program to address climate change.
The carbon sink/source of continental marginal seas is generally influenced by various processes, such as anthro- pogenic activities, hydrological dynamics, terrestrial riverine discharge, and phytoplankton growth. To obtain an exact estimation of carbon budget in continental marginal seas and understand the important roles of continental marginal seas in global carbon cycling processes, intensive cooperation of diverse subjects, appropriate arrangement of field survey, and stable economic support are of great importance. Fur- thermore, a comprehensive understanding of carbon sink/ source characteristics in different marginal seas requires long-term observation and continuous survey. In the future, we need to restructure the structure and policy of the marine economy, research methods of biological carbon sequestra- tion and establish detailed regulations of “carbon trading”, for the sake of “reducing carbon release” and “increasing carbon sinking”.
MCP is still under debate (Hansell and Carlson, 2002; Jiao et al., 2010). As our model does not represent the effect of a larger proportion of PP being transformed into RDOC under low nutrient conditions (Jiao et al., 2010), the reducion of PRDOC (?1.4%) was smaller than the decline of PP (?2.0%) in ExpT2 and was due to the relative increase in bacteria ac- tivity. Moreover, the higher PRDOC in ExpT4 than ExpT2, as evident in Table 1, suggests an increasing bacteria activity in response to the increased temperature, which partially compensates the PP reduction by enhanced remineralization.
4.2 Influence by community structure
Shifts in phytoplankton community structure can sig- nificantly affect carbon cycling in surface waters and exports to the deep ocean (Jiao et al., 2014b). Generally, in nutrient- replete ecosystems, large phytoplankton such as diatoms grow rapidly, and the communities is favorable for POC export. Thus, diatoms often dominate in episodic phyto- plankton blooms and contribute to the BP (Buesseler et al., 1998). In contrast, when the ecosystem is under strongly stratified and nutrient-limited conditions, pico- and nano- phytoplankton often dominate the ecosystem. This condition is less favorable for export production, as the small-size particles tend to suspend in the surface water, favoring the sequestration of MCP. The role of community structure on the BP and the MCP was also revealed with in situ data in the Western SCS (Jiao et al., 2014b).
In the SCS where basin-wide upwelling occurred year- round (Wong et al., 2007), diatom was the most abundant species, presenting higher assemblage in winter (by cellMCP, the geographical map of the correlation between the production percentage contributed by picophytoplankton (P1%) and the PRDOC is shown in Figure 9. For each grid, the correlation coefficient was calculated between the multiyear time series of P1% and PRDOC (vertical integrated). For most of the SCS, the correlation coefficients were well over 0.6, suggesting that P1% could be a reasonable proxy for the intensity of MCP, especially in the Vietnam and Luzon up- welling systems, where the correlation was even higher, with a maximum value of >0.9. In the low correlation regions, the P1% presented vague seasonal cycles and higher overall values. One example where this occurred is the central Lu- zon Strait, where the ecosystem is dominated by Kuroshio water year-round. This implies that the proxy could be more applicable in areas with higher community structure contrast. Moreover, diatom dominated the decline in both of the two experiments due to its sensitivity in nutrient demand. The decline in production was accompanied by community structure shifts toward more picophytoplankton, as shown in Table 1. Moore et al. (2013) suggested the reduced fraction of diatom’s contribution to the total PP in global warming scenarios. As diatom was much more efficient in the BP than other phytoplankton groups, the global warming condition may favor the MCP processes, as the model projection
suggests.
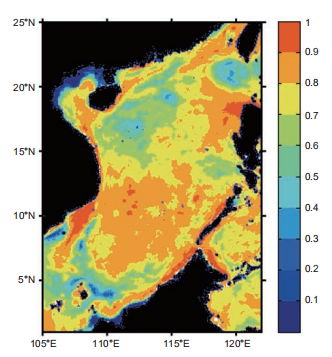
Figure 9 Correlation coefficients between the percentage of primary production contributed by picophytoplankton (P1%) versus PRDOC. Calcu- lated from the time series in the multiyear run.
5. Summary and conclusion
The spatiotemporal variability and relative importance of the BP and the MCP in the SCS were simulated and accessed with a coupled physical-ecosystem model. In current stan- dard model setting, the relative magnitude of MCP to BP (at the depth of 1000 m) had a ratio of 1:6.08. Considering the extremely long age of RDOC, this ratio is considered sig- nificant, indicating comparable roles of the two mechanisms. The annual production rate of RDOC averaged over the entire SCS domain was estimated to be 1.55 mg C m?2 d?1. The seasonality and distribution of MCP were largely de- termined by physical processes and the intensity of microbial activity.
Moreover, two numerical experiments with scenarios comparable to RCP4.5 and RCP8.5 were conducted to ad- dress the potential impacts of surface warming on the BP and the MCP. The model-projected near-surface stratification reduced the nutrient supply to the euphotic zone, which, in turn, decreased the PP and carbon export. The response of the BP is proportional to the changing climate, whereas the response of the MCP-related processes was rather nonlinear. In particular, our results indicate that the increased surface temperature could favor the microbial activities, thereby partially compensating the PP reduction. The decline of production in both scenarios was dominated by a reduction in diatom production, while the contribution from picophyto- plankton contrarily increased. This projection suggests that under global warming conditions, the MCP-to-BP ratio might likely increase accompanied by a shift in the com- munity structure, indicating a more important role of the MCP carbon sequestration in the ocean’s future.
Acknowledgements The authors thank Dr. T Trull from University of Tasmania, Dr. E Laws from Louisiana State University, and two anonymous reviewers for their constructive input that helped to improve this paper. This work was supported by the National Basic Research Program (Grant No. 2013CB955704), the National Program on Global Change and Air-Sea Interaction (Grant No. GASI-03-01-02-05). This study was also partially supported by the SOA Global Change and Air-Sea Interaction Project (Grant No. GASI-IPOVAI-01–04), the National Natural Science Foundation of China (Grant Nos. 41630963, 41476007 & 41476005).
References
Barnier B, Siefridt L, Marchesiello P. 1995. Thermal forcing for a global ocean circulation model using a three-year climatology of ECMWF analyses. J Mar Syst, 6: 363–380
Bauer J E, Williams P M, Druffel E R M. 1992. 14C activity of dissolved organic carbon fractions in the north-central Pacific and Sargasso Sea. Nature, 357: 667–670
Behrenfeld M J, Falkowski P G. 1997. Photosynthetic rates derived from satellite-based chlorophyll concentration. Limnol Oceanogr, 42: 1–20
Benner R, Herndl G. 2011. Bacterially derived dissolved organic matter in the microbial carbon pump. In: Jiao N, Azam F, Sanders S, eds. Mi- crobial Carbon Pump in the Ocean. Washington D C: AAAS/Science. 46–48
Buesseler K, Ball L, Andrews J, Benitez-Nelson C, Belastock R, Chai F, Chao Y. 1998. Upper ocean export of particulate organic carbon in the Arabian Sea derived from thorium-234. Deep-Sea Res Part II-Top Stud Oceanogr, 45: 2461–2487
Chai F, Liu G, Xue H, Shi L, Chao Y, Tseng C M, Chou W C, Liu K K. 2009. Seasonal and interannual variability of carbon cycle in South China Sea: A three-dimensional physical-biogeochemical modeling study. J Oceanogr, 65: 703–720
Chen J, Zheng L, Wiesner M G, Chen R, Zheng Y, Wong H K. 1998. Estimations of primary production and export production in the South China Sea based on sediment trap experiments. Chin Sci Bull, 43: 583– 586
Chen Y L L. 2005. Spatial and seasonal variations of nitrate-based new production and primary production in the South China Sea. Deep-Sea Res Part I-Oceanogr Res Pap, 52: 319–340
Chisholm S W. 2000. Oceanography: Stirring times in the Southern Ocean.
Nature, 407: 685–686
Chou W C, Sheu D D D, Chen C T A, Wang S L, Tseng C M. 2005. Seasonal variability of carbon chemistry at the SEATS Site, Northern South China Sea Between 2002 and 2003. Terr Atmos Ocean Sci, 16: 445–465
Ducklow H. 2000. Bacterial production and biomass in the oceans. Mi- crobial Ecol Oceans, 1: 85–120
Ducklow H W, Steinberg D K, Buesseler K O. 2001. Upper ocean carbon export and the biological pump. Oceanography, 14: 50–58
Gruber D F, Simjouw J P, Seitzinger S P, Taghon G L. 2006. Dynamics and characterization of refractory dissolved organic matter produced by a pure bacterial culture in an experimental predator-prey system. Appl Environ Microbiol, 72: 4184–4191
Guo M, Chai F, Xiu P, Li S, Rao S. 2015. Impacts of mesoscale eddies in the South China Sea on biogeochemical cycles. Ocean Dyn, 65: 1335– 1352
Hansell D A. 2013. Recalcitrant dissolved organic carbon fractions. Annu Rev Mar Sci, 5: 421–445
Hansell D A, Carlson C A. 2002. Biogeochemistry of Marine Dissolved Organic Matter. San Diego: Academic Press
Huang C, Qiao F, Song Y. 2014. The simulation and forecast of SST in the South China Sea by CMIP5 models (in Chinese). Acta Ocean Sin, 36: 38–47
IPCC. 2013. Climate Change 2013: The Physical Science Basis. Con- tribution of Working Group I to the Fifth Assessment Report of the Intergovernmental Panel on Climate Change, Annex III: Glossary. Cambridge: Cambridge University Press
Jiang Y, Chai F, Wan Z, Zhang X, Hong H. 2011. Characteristics and mechanisms of the upwelling in the southern Taiwan Strait: A three- dimensional numerical model study. J Oceanogr, 67: 699–708
Jiao N, Herndl G J, Hansell D A, Benner R, Kattner G, Wilhelm S W, Kirchman D L, Weinbauer M G, Luo T, Chen F, Azam F. 2010. Mi- crobial production of recalcitrant dissolved organic matter: Long-term carbon storage in the global ocean. Nat Rev Microbiol, 8: 593–599
Jiao N, Robinson C, Azam F, Thomas H, Baltar F, Dang H, Hardman- Mountford N J, Johnson M, Kirchman D L, Koch B P, Legendre L, Li C, Liu J, Luo T, Luo Y W, Mitra A, Romanou A, Tang K, Wang X, Zhang C, Zhang R. 2014a. Mechanisms of microbial carbon seques- tration in the ocean-future research directions. Biogeosciences, 11: 5285–5306
Jiao N, Zhang Y, Zhou K, Li Q, Dai M, Liu J, Guo J, Huang B. 2014b. Revisiting the CO2 “source” problem in upwelling areas—A com- parative study on eddy upwellings in the South China Sea. Bio- geosciences, 11: 2465–2475
Kalnay E, Kanamitsu M, Kistler R, Collins W, Deaven D, Gandin L, Iredell M, Saha S, White G, Woollen J, Zhu Y, Leetmaa A, Reynolds R, Chelliah M, Ebisuzaki W, Higgins W, Janowiak J, Mo K C, Ropelewski C, Wang J, Jenne R, Joseph D. 1996. The NCEP/NCAR 40-year re- analysis project. Bull Amer Meteorol Soc, 77: 437–471
Le Qu r C, Peters G P, Andres R J, Andrew R M, Boden T A, Ciais P, Friedlingstein P, Houghton R A, Marland G, Moriarty R. 2014. Global carbon budget 2013. Earth Syst Sci Data, 6: 235–263
Lechtenfeld O J, Hertkorn N, Shen Y, Witt M, Benner R. 2015. Marine sequestration of carbon in bacterial metabolites. Nat Commun, 6: 6711 Legendre L, Rivkin R B, Weinbauer M G, Guidi L, Uitz J. 2015. Themicrobial carbon pump concept: Potential biogeochemical significance in the globally changing ocean. Prog Oceanogr, 134: 432–450
Liao E H, Jiang Y W, Li L, Hong H S, Yan X H. 2013. The cause of the 2008 cold disaster in the Taiwan Strait. Ocean Model, 62: 1–10
Lin X, Yan X H, Jiang Y, Zhang Z. 2016. Performance assessment for an operational ocean model of the Taiwan Strait. Ocean Model, 102: 27–44 Liu G, Chai F. 2008. Seasonal and interannual variability of primary and export production in the South China Sea: A three-dimensional physi-
cal-biogeochemical model study. ICES J Mar Sci, 66: 420–431
Liu K K, Chao S Y, Shaw P T, Gong G C, Chen C C, Tang T Y. 2002. Monsoon-forced chlorophyll distribution and primary production in the South China Sea: Observations and a numerical study. Deep-Sea Res Part I-Oceanogr Res Pap, 49: 1387–1412
Lu W, Yan X H, Han L, Jiang Y. 2017. One-dimensional ocean model with three types of vertical velocities: A case study in the South China Sea. Ocean Dyn, 67: 253–262
Lu W, Yan X H, Jiang Y. 2015. Winter bloom and associated upwelling northwest of the Luzon Island: A coupled physical-biological modeling approach. J Geophys Res-Oceans, 120: 533–546
Ma W, Chai F, Xiu P, Xue H, Tian J. 2013. Modeling the long-term variability of phytoplankton functional groups and primary productivity in the South China Sea. J Oceanogr, 69: 527–544
Ma W, Chai F, Xiu P, Xue H, Tian J. 2014. Simulation of export production and biological pump structure in the South China Sea. Geo-Mar Lett, 34: 541–554
Moore J K, Lindsay K, Doney S C, Long M C, Misumi K. 2013. Marine Ecosystem Dynamics and Biogeochemical Cycling in the Community Earth System Model [CESM1(BGC)]: Comparison of the 1990s with the 2090s under the RCP4.5 and RCP8.5 Scenarios. J Clim, 26: 9291– 9312
Ning X, Chai F, Xue H, Cai Y, Liu C, Shi J. 2004. Physical-biological
oceanographic coupling influencing phytoplankton and primary pro- duction in the South China Sea. J Geophys Res, 109: 10-2004jc002365 Ogawa H, Amagai Y, Koike I, Kaiser K, Benner R. 2001. Production of refractory dissolved organic matter by bacteria. Science, 292: 917–920 Osterholz H, Niggemann J, Giebel H A, Simon M, Dittmar T. 2015. In- efficient microbial production of refractory dissolved organic matter in
the ocean. Nat Commun, 6: 7422
Passow U, Carlson C. 2012. The biological pump in a high CO2 world. Mar Ecol Prog Ser, 470: 249–271
Shchepetkin A F, McWilliams J C. 2005. The regional oceanic modeling system (ROMS): A split-explicit, free-surface, topography-following- coordinate oceanic model. Ocean Model, 9: 347–404
Wang J, Hong H, Jiang Y, Chai F, Yan X H. 2013. Summer nitrogenous nutrient transport and its fate in the Taiwan Strait: A coupled physical- biological modeling approach. J Geophys Res-Oceans, 118: 4184–4200 Wohlers J, Engel A, Z?llner E, Breithaupt P, J rgens K, Hoppe H G, Sommer U, Riebesell U. 2009. Changes in biogenic carbon flow in response to sea surface warming. Proc Natl Acad Sci USA, 106: 7067–
7072
Wong G T F, Ku T L, Mulholland M, Tseng C M, Wang D P. 2007. The SouthEast Asian Time-series Study (SEATS) and the biogeochemistry of the South China Sea—An overview. Deep-Sea Res Part II-Top Stud Oceanogr, 54: 1434–1447
Woodruff S D, Slutz R J, Jenne R L, Steurer P M. 1987. A comprehensive ocean—Atmosphere data set. Bull Amer Meteorol Soc, 68: 1239–1250 Wu K, Dai M, Chen J, Meng F, Li X, Liu Z, Du C, Gan J. 2015. Dissolved organic carbon in the South China Sea and its exchange with the Western Pacific Ocean. Deep-Sea Res Part II-Top Stud Oceanogr, 122:
41–51
Xiu P, Chai F. 2014. Connections between physical, optical and biogeo- chemical processes in the Pacific Ocean. Prog Oceanogr, 122: 30–53
(Responsible editor: Nianzhi JIAO)