

Carbon fluxes in the China Seas: An overview and perspective
Qian LIU, Xianghui GUO, Zhiqiang YIN, Kuanbo ZHOU, Elliott Gareth ROBERTS & Minhan DAI*
State Key Laboratory for Marine Environmental Science, Xiamen University, Xiamen 361005, China
Received September 14, 2017; revised August 9, 2018; accepted August 31, 2018; published online October 9, 2018
Abstract
This paper aims to provide an overview of regional carbon fluxes and budgets in the marginal seas adjacent to China. The “China Seas” includes primarily the South China Sea, East China Sea, Yellow Sea, and the Bohai Sea. Emphasis is given to CO2 fluxes across the air-sea interface and their controls. The net flux of CO2 degassing from the China Seas is estimated to be 9.5 53 Tg C yr?1. The total riverine carbon flux through estuaries to the China Seas is estimated as 59.6 6.4 Tg C yr?1. Chinese estuaries annually emit 0.74 0.02 Tg C as CO2 to the atmosphere. Additionally, there is a very large net carbon influx from the Western Pacific to the China Seas, amounting to ~2.5 Pg C yr?1. As a first-order estimate, the total export flux of particulate organic carbon from the upper ocean of the China Seas is 240 80 Tg C yr?1. This review also attempts to examine current knowledge gaps to promote a better understanding of the carbon cycle i n this important region.
Keywords Air-sea CO2 fluxes, Marine biogeochemistry, Marginal seas, Ocean carbon cycle, China Seas
Citation: Liu Q, Guo X, Yin Z, Zhou K, Roberts E G, Dai M. 2018. Carbon fluxes in the China Seas: An overview and perspective. Science China Earth Sciences, 61: 1564–1582, https://doi.org/10.1007/s11430-017-9267-4
1.Introduction
There has been substantial evidence linking anthropogenic activities to the perturbation of the natural carbon cycle since the industrial revolution (Canadell et al., 2010; Falk- owski et al., 2000). In recent history, carbon emissions have increased from 6.4 Pg C yr?1 (1 Pg C=1015 g C) in the 1990s to 39.2 Pg C yr?1 during 2007–2016, including 34.3 2.0 Pg C yr?1 released by fossil fuel burning and in- dustrial processes, and 4.9 3.0 Pg C yr?1 by land-use change (Le Qu r et al., 2017). About 47% of this anthropogenic CO2 remains in the atmosphere, while the other 53% enters marine (23%) and terrestrial (30%) ecosystems through air- sea and land-air exchanges (Le Qu r et al., 2017).
By May 2017, the atmospheric CO2 concentration had reached 406 ppm (https://www.esrl.noaa.gov/gmd/ccgg/ trends/global.html) (1 ppm=1 mol mol?1), an increase ofover 45% since the industrial revolution. As a greenhouse gas, increased atmospheric CO2 concentrations have led to increased surface temperatures on Earth. As such, the study of CO2 as a key component of the carbon cycle has attracted wide attention, becoming one of the most active research areas in the Earth sciences (Cai et al., 2003; Pan et al., 2011; Regnier et al., 2013; Sabine et al., 2004). These observa- tional studies aim to reduce uncertainties in carbon flux es- timates, to clarify anthropogenic perturbations, and to reveal controlling processes and mechanisms in order for a more accurate prediction of future variations in the Earth’s climate. As a gigantic reservoir containing 38118 Pg C (Sarmiento and Gruber, 2002), which far exceeds the amount of carbon stored in the atmosphere, the ocean reduces the rate of in- crease in atmospheric CO2. Since the industrial revolution, the ocean has absorbed ~40% of anthropogenic CO2 (DeV- ries et al., 2017). Based on the Fifth Assessment Report by the Intergovernmental Panel on Climate Change, the ocean stored 2.0 0.7 Pg C yr?1 as anthropogenic CO2 during 1980–
1989, and it increased to 2.3 0.7 Pg C yr-1 during 2000– 2009. This suggests that within this 20 years period, the oceanic carbon storage increased at a rate of 0.15 Pg C every 10 years (Ciais et al., 2013).
The ocean absorbs atmospheric CO2 primarily through three processes: the “biological pump”, the “solubility pump”, and the “carbonate pump”. The biological pump mainly occurs in the euphotic zone, where phytoplankton transforms dissolved inorganic carbon (DIC) to dissolved organic carbon (DOC) and particulate organic carbon (POC) via photosynthesis. A fraction of this organic carbon is transported into the deep ocean by POC settling and the downward diffusion of DOC. The solubility pump often re- fers to processes occurring at high latitudes, such as in the North Atlantic Ocean and the Southern Ocean, where sea- water cooling and/or freezing promotes an increase in both CO2 solubility and seawater density that carries high CO2 water to depth via sinking. The carbonate pump is another important process that exerts a control on the ocean carbon cycle, where carbonate precipitation in seawater leads to the net release of CO2. A large amount of carbonate in sediments modulates atmospheric CO2 concentrations through calcium carbonate production and dissolution in the deep sea. Spe- cifically, carbonate dissolution in the deep sea can draw down atmospheric CO2, while carbonate precipitation can release CO2 (Elderfield, 2002). Additionally, Jiao et al. (2010) proposed the “non-settling biological pump”, or the “microbial carbon pump”, which refers to the microbial process of transforming labile DOC to refractory DOC.
For open-ocean CO2 uptake and release through above processes, large spatial and temporal variations have been observed (Takahashi et al., 2009). The general global trend is that low latitude regimes generally outgas CO2, and mid- and high latitude regions often absorb CO2. In particular, the North Atlantic Ocean and the Southern Ocean are two of the strongest sinks for anthropogenic CO2. Regions where mode water is produced in mid-latitude are also important sinks of atmospheric CO2. In contrast, the equatorial Pacific Ocean is a very big carbon source with the highest inter-annual variability (Takahashi et al., 2009 and references therein).
Marginal seas have their own unique geographical, phy- sical, chemical, and biological characteristics that include intensive land-ocean-atmosphere interactions (Dai et al., 2013a). Firstly, marginal seas are significantly affected by terrestrially-sourced natural and anthropogenic carbon and nutrients (Liu et al., 2010a). Secondly, they generally have high rates of primary productivity, as well as a complicated biological community structure (Liu et al., 2010a, 2010b). The primary production, microorganism recycling, and car- bon settling and export that occur in marginal seas vary with respect to these same processes in the open ocean. Thirdly, at marginal seas with relatively shallow water depths, particu- late carbon can quickly settle to the bottom and affect thesediment-water interface (Hung et al., 2013), and therefore can directly influence the carbon cycle in the overlying seawater and CO2 exchange at the air-sea interface. Lastly, the CO2 absorbed by marginal seas can be exported to the open ocean via the continental shelf pump (Tsunogai et al., 1999) and vice-versa (e.g., Dai et al., 2013a and references therein). Additionally, coastal upwelling complicates the role of the ocean margin as a CO2 sink or source by bringing CO2 and nutrient-enriched deep water to the surface. If the in- crease in primary productivity stimulated by the additional nutrients cannot compensate the free CO2 brought up from depth, the coastal system will tend to release CO2 to the atmosphere (Cai, 2011).
Over the past two decades, significant research efforts have been devoted to the study of the carbon cycle in mar- ginal seas. Considerable field observations and simulations were conducted that have significantly improved the accu- racy of air-sea CO2 flux estimates therein, as well as our understanding of ocean margin carbon cycling as a whole. Previous synthesis analyses of available data revealed that marginal seas appear to be a sink of atmospheric CO2 on a global scale, of approximately 0.2–0.4 Pg C yr?1 (Borges, 2011; Borges et al., 2005; Cai, 2011; Cai et al., 2006; Chen and Borges, 2009; Dai et al., 2013a; Laruelle et al., 2010; Liu et al., 2010a). Laruelle et al. (2014) updated this estimation by considering the partial sea ice cover of polar shelves by utilizing the global ocean CO2 atlas (Surface Ocean CO2 Atlas, SOCAT) data. This led to a new approximation of atmospheric CO2 uptake by marginal seas of 0.19 0.05 Pg C yr?1, which is the lower boundary of the previous estimates.
It was previously postulated that the latitude of an ocean margin determined its CO2 sink-source pattern (Cai and Dai, 2004; Cai et al., 2006). Owing to high temperatures and large inputs of terrestrial organic carbon, low latitude marginal seas typically release CO2 (Cai and Dai, 2004; Cai et al., 2006; Cai, 2011). Assessments of global riverine DOC fluxes revealed that 60% of the riverine DOC are discharged into low-latitude seas (Dai et al., 2012). Dai et al. (2013a) pro- posed that world marginal seas, in terms of external carbon inputs and internal cycling rates, can be placed into at least two categories: river-dominated ocean margins (RiOMars) and ocean-dominated margins (OceMars). RiOMars are featured by concurrent inputs of high loadings of both au- totrophic (nutrients) and heterotrophic (organic matter) ma- terial, while OceMars are characterized by concurrent off- site sources, along the barocline, contributing nutrients and dissolved inorganic carbon (DIC) into the system (Dai et al., 2013a; Cao et al., 2014).
This study sought to synthesize CO2 air-sea fluxes of the marginal seas adjacent to China (China Seas): the South China Sea (SCS), East China Sea (ECS), Yellow Sea (YS) and Bohai Sea (BS) (Figure 1). We summarized carbon fluxes along the river-sea interface, carbon exchange be- tween the ocean margin and the open ocean, and POC export fluxes from the euphotic layer. Based on this analysis, we constructed a preliminary and simplified carbon budget for the China Seas and compared our estimates with air-sea CO2 fluxes in other marginal seas worldwide.
2.The carbon cycle in the China Seas
The China Seas account for approximately 12% of the total surface area of global continental margins, and span the temperate, subtropical, and tropical zones. The China Seas receive inputs from large rivers such as the Changjiang (Yangtze) and Zhujiang (Pearl) rivers, and also exchange with the Kuroshio, a major western ocean boundary current. As a result, the carbon cycle in the China Seas is rather complex (Dai et al., 2004), and have attracted great attention in the past few decades. At the beginning of this century, Chinese scientists published a first monograph on material fluxes on continental margins (Hu and Yang, 2001), in which the ECS was revealed as a weak sink for atmospheric CO2. This result, as well as multiple studies on the CO2 sink- source pattern in the ECS conducted by scientists from sur- rounding countries and regions (Chou et al., 2009, 2011;Shim et al., 2007; Tsunogai et al., 1999), have been widely discussed in international communities. The ECS has therefore been frequently cited as a case-study of global continental margins that absorb atmospheric CO2. More re- cently, the Ministry of Science and Technology of China, the Natural Science Foundation of China, the State Oceanic Administration (SOA), and the Chinese Academy of Sci- ences have funded a number of projects related to carbon cycle to investigate material transport, nutrient cycling, and primary productivity in the China Seas. These financial contributions enabled scientists to obtain a large amount of observational data and results. Major projects, such as the “Carbon Cycle in the South China Sea: budget, controls & global implications” under the National Key Basic Research Program of China, are still ongoing to better understand the ocean’s carbon cycle in the China Seas (Dai and Yin, 2016).
2.1Air-sea CO2 fluxes
2.1.1South China Sea
Based on a mass balance model built on a limited dataset collected in the 1990s, Chen et al. (2006) concluded that the SCS basin is a weak source of atmospheric CO2. However, time-series observational studies at SEATS (The South East Asia Time-series Station, Figure 1) in the northern SCS (NSCS) basin showed that the region is a weak CO2 sink or near equilibrium with the atmosphere on an annual basis between December 1999 and December 2009 (Chou et al., 2005; Sheu et al., 2010; Tseng et al., 2007). Other field surveys show that the NSCS, including the shelf region, is a CO2 source during warm seasons, a CO2 sink during cold seasons, and a weak source on an annual scale (Zhai et al., 2005, 2009). The Sunda shelf in the southern SCS is also a CO2 source in early fall (Rehder and Suess, 2001).
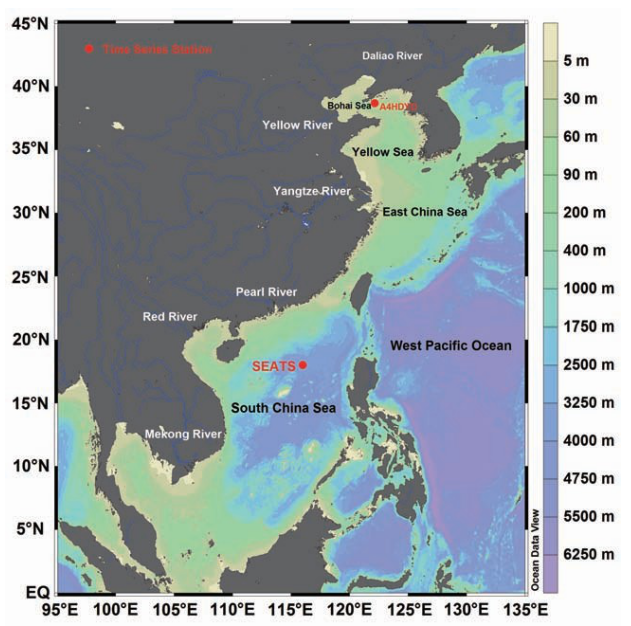
Figure 1 Geographic map of the China Seas. SEATS (South East Asian Time-Series Study) represents the time-series station in the South China Sea (Chou et al., 2005), and A4HDYD represents the time-series station in the Yellow Sea (Xu et al., 2016).
Zhai et al. (2013) provided the most comprehensive as- sessment of CO2 fluxes and their controls in the SCS, based on a large dataset of 14 field CO2 mapping surveys between 2003 and 2008. These authors divided the SCS into 4 do- mains, according to zonal physical and biogeochemical characteristics (Figure 1 in Zhai et al., 2013). In their study, Domain A was the NSCS shelf influenced by the Zhujiang River, Domain B was the NSCS slope and basin, Domain C was the middle SCS basin, and Domain D was the basin west of the Luzon Strait, which might be affected by winter up- welling. The partial pressure of CO2 (pCO2) in Domain A was relatively low and showed little seasonal variation (320– 390 atm). pCO2 in Domain B revealed a seasonal pattern of high values during warm seasons (summer and spring) and low values during cold seasons (winter and fall). pCO2 in Domain C was relatively high all year round (360–425 atm). In Domain D, pCO2 was high during the winter up- welling periods. The area-weighted annual average CO2 flux was 1.1 1.7 mmol m?2 yr?1, and the 4 domains emitted 18 27.6 Tg C yr?1 of CO2 (with the surface area of the 4 domains being 1.34 106 km2). Extrapolated to the entire SCS proper (with a surface area of 2.5 106 km2 excluding the Gulfs of Thai and Beibu), the entire SCS emitted 33.6 51.3 Tg C yr?1 (1 Tg C=1012 g C; Zhai et al., 2013).
The major controls of surface water pCO2 and air-sea CO2 fluxes differ among the 4 domains. pCO2 in Domain A is mainly driven by biological processes and seasonal varia- tions in sea surface temperature (SST), whereby pCO2 is drawn down due to cooling during cold seasons and high rates of phytoplankton uptake during warm seasons (i.e. summer). pCO2 in Domain B is mainly controlled by SST, with low pCO2 during cold seasons and high pCO2 during warm seasons. pCO2 in Domain C is also dominated by temperature, where high temperatures during all the seasons results in high pCO2 values throughout the year. Air-sea CO2 fluxes in Domain D are mainly dominated by winter up- welling (Zhai et al., 2013).
2.1.2East China Sea
The CO2 in ECS surface water is usually undersaturated with respect to the atmosphere, and thus the ECS generally serves as an annual net sink of atmospheric CO2 with an air-sea CO2 flux in the range of –(10–30) Tg C yr?1 (Chou et al., 2009, 2011, 2013; Peng et al., 1999; Shim et al., 2007; Tsunogai etal., 1999; Wang et al., 2000; Tseng et al., 2011). Based on a dataset from 8 summer cruises and 5 cruises conducted during other seasons, Tseng et al. (2014) evaluated the an- nual average air-sea CO2 flux to be ?1.8 0.5 mol C m?2 yr?1 by establishing an empirical formula between surface water pCO2 and freshwater discharge from the Changjiang River. It should be noted that high pCO2 in fall is a typical feature in the ECS, which has been often observed (Zhai and Dai, 2009; Zhai et al., 2007), but it is not a function of Changjiang discharge (e.g., Zhai and Dai, 2009), therefore the empirical algorithm cannot accurately estimate the distributions of surface water pCO2 in fall.
Based on 24 surveys conducted over the entire ECS shelf in 4 seasons of the year during 2006–2011, Guo et al. (2015) presented a comprehensive dataset of surface seawater pCO2 and associated air-sea CO2 fluxes. They classified the ECS into 5 domains that featured differing physics and bio- geochemistry (Figure 1 in Guo et al., 2015). The 5 domains were the Changjiang plume (I), the Zhejiang-Fujian coast (II), the northern shelf (III), the middle shelf (IV), and the southern shelf (V). Overall, surface water pCO2 showed strong spatial and seasonal variations. In the Changjiang plume, pCO2 was as low as <100 atm during winter, spring, and summer, but high in the fall (>360 atm). Along the Zhejiang-Fujian coast, pCO2 during winter, spring, and summer (300–350 atm) were also lower than during fall (>350 atm), but the seasonal variation was smaller than the Changjiang plume seasonal variability. In the ECS outer shelf (the area impacted by the Kuroshio), pCO2 was higher during warm seasons than cold seasons (Figure 2).
In general, the Changjiang plume and the Zhejiang-Fujian coast were sinks of atmospheric CO2 during winter, spring and summer, but a CO2 source in fall. The northern, middle, and southern shelves were sinks of atmospheric CO2 during cold seasons and CO2 sources during warm seasons. Overall, the 5 domains were all CO2 sinks annually with an area- weighted CO2 flux of ?2.5 1.5 mol m?2 yr?1 (Guo et al., 2015). This approximation was twice the global average of marginal seas CO2 fluxes. The surface area of the ECS with water depths <200 m is 0.45 106 km2, and this region ab- sorbed CO2 from the atmosphere at a rate of 13.2 Tg C yr?1 (Guo et al., 2015). Extrapolated to the entire ECS (0.77 106 km2), it sequesters 23.3 13.5 Tg C yr-1 of CO2.
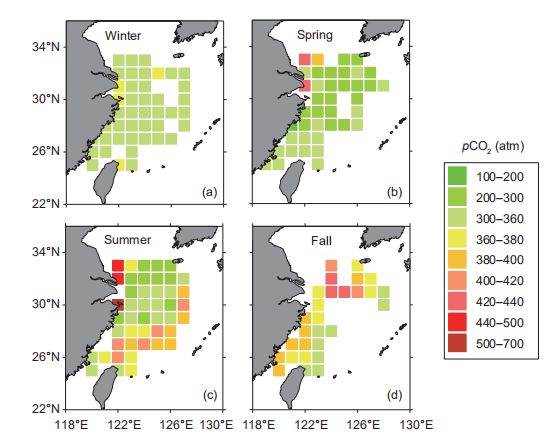
Figure 2 Distribution of seasonal averages of pCO2 in 1 1 grids on the East China Sea (ECS) shelf (based from Guo et al., 2015). Atmospheric CO2
increased at a rate of 2 atm yr–1 (http://scrippsco2.ucsd.edu/), leading to a similar rate of increase in sea surface pCO2. Tseng et al. (2014) report that pCO2 in
the surface water of the ECS increases at a rate of 2.1 atm yr?1. Since the sea surface pCO2 data used in this study was collected from different cruises during
2006 to 2011, the seawater pCO2 data were normalized to June 2010 at the rate of 2.1 tm yr?1. When estimating the gridded average, the pCO2 data from
each cruise was first constrained to the 1 1 grid, and then the average value during each season was calculated.
The major controls on air-sea CO2 fluxes differ in the 5 domains of the ECS. Surface water pCO2 in the Changjiang plume and the Zhejiang-Fujian coast are mainly controlled by SST, biological processes, and vertical mixing. pCO2 is low in winter due to low SST in domains I and II. During warm seasons, the water column is stratified and biological uptake decreases the surface water pCO2. In fall, the strati- fication is destroyed by the decrease in SST and strong winds and surface pCO2 increases due to enhanced vertical mixing of the CO2-enriched bottom/subsurface water. However,pCO2 in the domains III, IV, and V is dominated by SST; i.e. containing low pCO2 with respect to the atmosphere during cold seasons and higher pCO2 in warm seasons (Guo et al., 2015).
In summary, various domains are very different with re- spect to air-sea CO2 fluxes and major controls on surface water pCO2. Within the domains I and II, pCO2 is low during winter, spring and summer, but high in the fall. For example, in the domain I, the seasonal average pCO2 during winter, spring, summer, and fall were 348, 309, 317, and 394 atm, and the air-sea CO2 fluxes were ?9.8, ?10.7, ?6.5, and2.2mmol m?2 d?1, respectively within the investigation by Guo et al. (2015). Therefore, the domain I is a CO2 sink in winter, spring, and summer, and a CO2 source during the fall. However, the outer shelf is temperature dominated; its sea- sonal average pCO2 and air-sea CO2 fluxes during the 4 seasons at the investigation’s time-frame were 344, 345, 381, and 348 atm, and ?10.0, ?6.8, 1.8, and ?8.4 mmol m?2 d?1, respectively. Thus, the outer shelf is a CO2 sink in winter, spring and fall, but a CO2 source in the summer.
2.1.3Yellow Sea
The YS is geographically divided into the North Yellow Sea (NYS) and the South Yellow Sea (SYS, along a line between Cape Chengshan on the Shandong Peninsula in China and Changshanchuan on the Korea Peninsula). Surface water pCO2 in the YS in April 1996 was 220–360 atm, with an average CO2 flux of ?2.34 mol m?2 yr?1. This estimation indicated that the YS is a moderate sink of atmospheric CO2(Oh et al., 2000). During 2006–2007, Xue et al. (2012) conducted 4 surveys in the YS and revealed that it is a CO2 source during all seasons, and it was a weak source on an annual scale (0.63 0.10 mol m?2 yr?1 of CO2). Based on time-series observations during the period of March 2011 to November 2013 at station A4HDYD located in the northwest of the NYS (Figure 1), the NYS is a weak sink of atmo- spheric CO2 (?0.85 0.59 mol C m?2 yr?1, Xu et al., 2016). In summation, CO2 in the NYS is generally near equilibrium with the atmosphere.
In the SYS, with data from observations during spring, summer, and fall, Xue et al. (2011) estimated the annual average air-sea CO2 flux to be 1.32 mol m?2 yr?1. This result indicated that the SYS is a weak source of atmospheric CO2. However, Qu et al. (2014) found that the western and central regions of the SYS were a weak CO2 sink (?1.02 mol m?2 yr?1). Similarly, Luo et al. (2015) argued that the central YS is a weak CO2 sink (?0.70 mol m?2 yr?1) based on estimations using numerical models.SOA surveyed the entire YS and found that it was a sink of atmospheric CO2 during winter, spring, and summer, but a source in the fall. Annually, the YS was estimated to be a weak CO2 sink (?0.2 0.1 mol m?2 yr?1, State Oceanic Ad- ministration, 2013). The YS sequesters 1.0 0.3 Tg C yr?1 of CO2 if a surface area of 0.38 106 km2 is adopted (State Oceanic Administration, 2013).
2.1.4Bohai Sea
Generally, the study of air-sea CO2 fluxes in the BS has beenvery limited. The CO flux was found to be 1.01 mol m?2 yr?1 in September, 2009 (Yin et al., 2012). Surveys conducted by the SOA (2013) during 2011–2012 show that the BS is a source of atmospheric CO2 in fall, a sink in winter and spring, and near-equilibrium with the atmosphere in summer. Annually, the BS is a weak source (0.2 0.1 mol m?2 yr?1) and emitting 0.2 0.1 Tg C yr?1 of CO2 to the atmosphere if a surface area of 7.7 104 km2 is adopted (SOA, 2013).
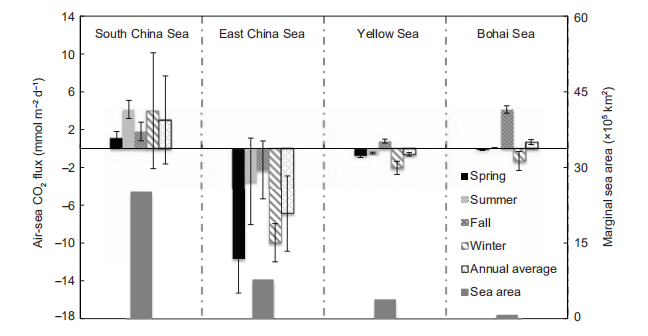
Figure 3 Air-sea CO2 seasonal variations and annual fluxes in the China Seas (South China Sea, East China Sea, Yellow Sea, and Bohai Sea). Negative values denote seawater absorbing CO2 from the atmosphere. Sea surface pCO2 values in the South China Sea and East China Sea were derived from Zhai et al. (2013) and Guo et al. (2015), respectively. pCO2 data in the Yellow Sea and Bohai Sea were primarily obtained from the State Oceanic Administration (2013). For air-sea CO2 fluxes, the average values are shown. The error bars represent standard deviation, which characterizes the spatial variations in fluxes. Details are presented in the text.
To sum up, the SCS is a CO2 source (33.6 51.3 Tg C yr?1), the ECS is a CO2 sink (23.3 13.5 Tg C yr?1), and the YS (1.0 0.3 Tg C yr?1) and BS (0.2 0.1 Tg C yr?1) are in near- equilibrium with the atmosphere with respect to CO2 (Figure 3). The China Seas, as a whole, are a source of atmosphericcoastal sediments, and the remaining 10% discharged into the ocean (0.1 Pg C yr?1).
There are four major rivers discharging into the China Seas: the Mekong River, the Zhujiang River, the Changjiang River and the Huanghe (Yellow) River. The Changjiang River is the largest river in China and the third largest river in the world, with a discharge rate (~900 km3 yr?1) accounting for 56% of the total river flow (1600 km3 yr?1) in China (Dai, 2016). The Changjiang River transports substantial amounts of freshwater, carbon, and nutrients to the ECS and YS. The Zhujiang River is the second largest river in China in terms of freshwater discharge (275 km3 yr?1, Huang et al., 2017), and significantly impacts the northeast SCS shelf. The Me-kong River is the seventh largest river worldwide (474 km3 yr?1, Huang et al., 2017), discharging into the SCS
2.2.1Fluvial total carbon fluxes to the China Seas
To evaluate the total riverine carbon fluxes to the China Seas, we first calculated river discharge-weighted average carbon concentrations using known forms of oceanic carbon (DIC, DOC, POC, and Particulate Inorganic Carbon, PIC) con- centrations of several rivers and their corresponding fresh- water discharge. The total riverine carbon flux into the estuaries was calculated as the product of discharge-weigh- ted average carbon concentrations and total freshwater dis- charge into the China Seas. The estuary is not only a passageway of materials from land to the ocean, but also a “reactor”. Biogeochemical processes lead to the addition or removal of carbon within the estuary and modify the net carbon flux to the sea. Therefore, the total riverine carbon flux into the China Seas was calculated by applying esti-mates of removal/addition rates of carbon in the estuaries to the riverine inputs. It should be noted that the Mekong River and the Zhujiang River are the two largest rivers flowing into the SCS. In addition, several other rivers located in south China, Vietnam, the Philippines, and Malaysia also discharge into the SCS, and are included in our calculations (Table 1).
(1)Changjiang River and Changjiang estuary. There are no marked seasonal variations of DIC and DOC in the Chang- jiang River. DIC ranged from 1585–1978 mol kg?1 (Zhai et al., 2007), with an average concentration of 1746 159 mol kg?1. DOC concentrations fluctuated from 1.64–2.74 mg L?1 (Wang et al., 2012), with a mean value of 2.03 0.27 mg L?1. The POC/DOC ratio is approximately 1 (Wang et al., 2012; Wu et al., 2007), comparable to the global mean ratio (McKee, 2003). POC and PIC show strong seasonal varia- tions and are higher during summer than in winter. POC and PIC ranged from 0.58–3.60 mg L?1 (mean 1.67 0.94 mg L?1) and 0.17–0.70 mg L?1 (0.36 0.16 mg L?1) (Wang et al., 2012), respectively. The DIC, DOC, PIC, and POC fluxes from the Changjiang River to the Changjiang estuary were 19.0 1.7, 1.84 0.2, 0.34 0.2, and 1.51 0.8 Tg C yr?1. These fluxes were calculated as the average concentrations of carbon (DIC, DOC, PIC, and POC) multiplied by mean Changjiang River discharge (from 1900–2004; Dai, 2016). Subsequently, the total carbon flux discharge into the Changjiang estuary was 22.7 1.9 Tg C yr?1.
(2)Zhujiang River and Zhujiang River estuary. The con- centration of DIC at the freshwater end-member in the Zhujiang River estuary is higher during winter (>2700 mol kg?1) than in summer (1000 mol kg?1), with an average of 1740 mol kg?1 (Guo et al., 2008). DOC concentrations ranged from 1.38–2.13 mg L?1, with a mean of 1.67 mg L?1 from 8 major riverine runoff outlets in the Zhujiang River (Ni et al., 2008). The DOC concentration during the dry season is higher than during the wet season, although this pattern is reversed for POC. Therefore, the POC/DOC ratio is higher during the wet season relative to the dry season (1–4 vs 0.2–1). PIC data is not available from the Zhujiang River estuary, if PIC is assumed to account for 0.97% of the total suspended matter (TSM; Huang et al., 2017), PIC concentrations would be 1.59 mg L?1. Using a similar approach for calculating Changjiang River carbon fluxes, we estimate the DIC, DOC, PIC, and POC fluxes to the Zhujiang River estuary as 5.75 3.3, 0.46 0.3, 0.44 0.3 and 2.10 1.2 Tg C yr?1, respectively. The total carbon input flux is estimated as 8.75 3.5 Tg C yr?1.
(3)Huanghe River and Yellow River estuary. The DIC concentration in the Huanghe River during the dry season (2570–3640 mol kg?1) is higher than in the wet season (2269–2752 mol kg?1), with an average of 3197 mol L?1 (Zhang and Zhang, 2007; Ran et al., 2013). The monthly variability in DOC (Lijin gauge station) was small, which ranges from 1.81–3.36 mg L?1 (Wang et al., 2012) to2.83–3.85 mg L?1 (Ran et al., 2013), with an average value of 2.83 0.56 mg L?1. Unlike in the Changjiang River and Zhujiang River, the POC/DOC ratio in the Huanghe River is as high as 12 (Wang et al., 2012). POC displayed large monthly variations with an average value of 14.6 14.3 mg L?1. The annual DIC, DOC, PIC, and POC flux discharge into the Yellow River estuary were 1.46 0.3, 0.11 0.02, 2.35 3.5 and 0.56 0.7 Tg C yr?1, with a total carbon flux of 4.47 3.6 Tg C yr?1.To summarize, the annual fluxes of DIC, DOC, PIC, and POC from the three major Chinese rivers to their estuaries were 26.2 3.7, 2.67 0.4, 3.11 3.5 and 4.17 1.6 Tg C yr?1,with a total carbon flux of 36.2 5.3 Tg C yr?1.
(4)Total riverine carbon flux discharging into the estu- aries. Recently, Huang et al. (2017) compiled a dataset of riverine fluxes and carbon concentrations from 51 rivers around the SCS, including the Mekong and the Zhujiang River. Xia and Zhang (2011) reported the concentrations of DIC, DOC, and POC in 16 rivers that discharge into the BS, such as the Ziyaxin River and the Daliaohe River. We cal- culated the river discharge-weighted average carbon con- centrations as follows: we sum the products that were obtained for each river by multiplying discharge and their corresponding carbon concentrations, and then divide by the total discharge of the rivers (only rivers with known carbon concentrations were included). Using the calculated dis- charge-weighted average carbon concentration and total re- ported river discharge into the China Seas (2208 km3 yr?1, including 34 rivers in China, and 13 rivers discharging into the SCS from the Philippines, Vietnam and Malaysia), we estimated the total riverine carbon flux discharging into the estuaries to be 64.9 6.8 Tg C yr?1, of which, 40.8 4.8 Tg C yr?1 was DIC, 6.87 1.3 Tg C yr?1 was DOC, 4.05 3.7 Tg C yr?1 was PIC, and 13.3 2.8 Tg C yr?1 was POC. Here, we do not consider the rivers those flow into the Gulf of Thailand. River discharge, carbon concentrations, and carbon fluxes are shown in Table 1.
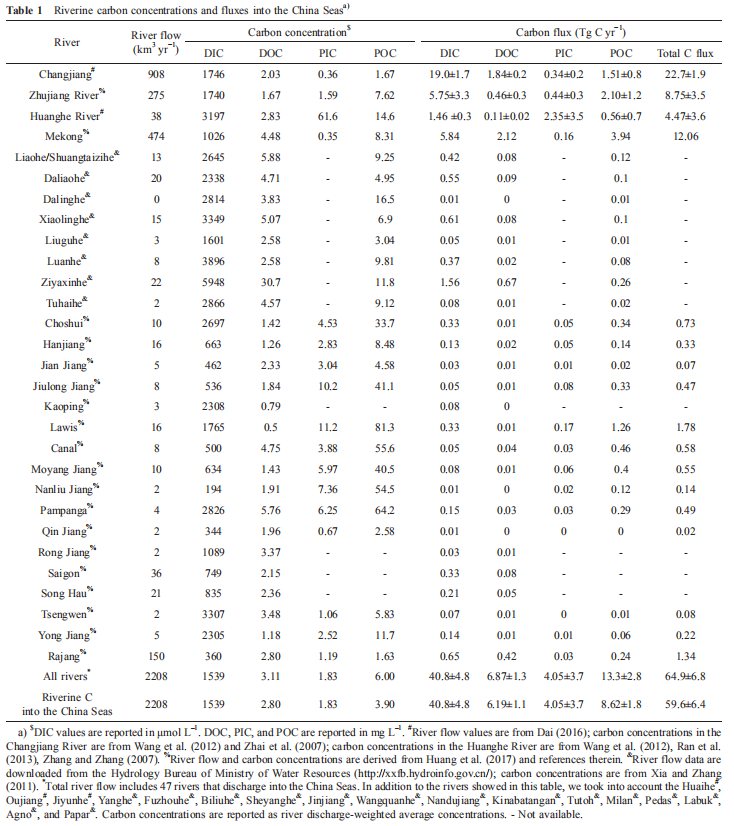
(5)Total riverine carbon flux discharging into the China Seas. To calculate the riverine carbon flux into marginal seas, the addition or removal of carbon in estuaries needs to be considered. For example, biogeochemical processes at the southern branch and the northern branch of the Changjiang estuary differ significantly. The southern branch acts like a “channel” through which terrestrial material enters the sea. In contrast, the northern branch behaves more like a “re- actor”, where strong organic carbon mineralization and DIC regeneration exist (Zhai et al., 2017). Zhai et al. (2017) found that the DIC released by biogeochemical processes (organic carbon mineralization and CaCO3 dissolution) in the north- ern branch of the Changjiang estuary accounts for 1.5–6.9% of the total DIC flux discharged from the Changjiang River in April 2010. These findings are distinct from findings in the Zhujiang estuary, where summer phytoplankton blooms at Figure 3 Air-sea CO2 seasonal variations and annual fluxes in the China Seas (South China Sea, East China Sea, Yellow Sea, and Bohai Sea). Negative values denote seawater absorbing CO2 from the atmosphere. Sea surface pCO2 values in the South China Sea and East China Sea were derived from Zhai et al. (2013) and Guo et al. (2015), respectively. pCO2 data in the Yellow Sea and Bohai Sea were primarily obtained from the State Oceanic Administration (2013). For air-sea CO2 fluxes, the average values are shown. The error bars represent standard deviation, which characterizes the spatial variations in fluxes. Details are presented in the text.the downstream end (outer Lingdingyang, Wanshan Islands, Dangan Islands) can cause significant DIC removal. In Au- gust 2005, a strong bloom occurred in the Zhujiang River estuary. This resulted in a DIC removal of up to ~40% of the riverine input (the effective concentration was reduced from 1628 to 984 mol kg?1; Guo X et al., 2009). Since the bloomsgenerally occur in summer, the DIC removal rate in the Zhujiang River estuary does not exceed 10% annually. Si- milarly, yearly DIC removal is ~10% in the Huanghe River estuary (Zhang and Zhang, 2007). Considering that biogeo- chemical processes can either produce or reduce DIC in es- tuaries, we assume that the DIC flux into an estuary is identical to the flux from the estuary to the marginal sea with an error less than 10%. In addition, the removal rate of POC in the estuaries of China has not been reported. Studies in the Zhujiang River estuary showed that at least 35% of the POC from the Zhujiang River was removed in the Lingdingyang (ignoring the contribution of on-site POC export; He Biyan, unpublished data). Therefore, we assigned the estuarine POC removal rate as 35%, and the DOC removal rate as 10% (Dai et al., 2012). Due to the minor riverine PIC flux, we ignore PIC removal or addition in the estuaries. Overall, the riverine fluxes of DIC, DOC, PIC, and POC into the China Seas were calculated to be 40.8 4.8, 6.19 1.1, 4.05 3.7 and 8.62 1.8 Tg C yr?1, respectively. This adds to a total carbon flux of 59.6 6.4 Tg C yr?1.
2.2.2Air-sea CO2 fluxes in estuaries
Since the turbidity in estuaries is generally high, weak light availability limits nutrient uptake and phytoplankton growth in most estuaries. pCO2 in upper estuaries is usually high, primarily due to limited biological uptake and strong aerobic respiration of terrestrial organic carbon. Therefore, most estuaries emit CO2 to the atmosphere (Chen et al., 2013). To evaluate the CO2 exchange fluxes in estuaries connecting to the China Seas, we first calculated CO2 fluxes in the three largest river estuaries (the Changjiang River, the Zhujiang River, and the Huanghe River estuaries) based on published data. Then we estimated the CO2 flux in all China’s estuaries, as a whole, based on the area-weighted CO2 flux of these river estuaries and the total surface area of all the estuaries. Surface water pCO2 in the upper Changjiang estuary ran- ged from 650–1440 atm. pCO2 in the Huangpu River, ain the lower Lingdingyang (Guo X et al., 2009). Corre- spondingly, the upper Lingdingyang is a strong CO2 source ( 50–350 mmol m?2 d?1 or 18–128 mol m?2 yr?1), while the lower Lingdingyang is a CO2 sink during summer (Guo X et al., 2009). The Zhujiang River estuary experiences large seasonal variations in air-sea CO2 fluxes, and area-weighted CO2 fluxes are 6 times higher in the summer than in winter. As the surface area of the upper Lingdingyang is small, the entire Zhujiang River estuary is a moderate CO2 source an- nually (6.92 mol m?2 yr?1). The surface area of the Zhujiang River estuary is 4360 km2 and it emits 0.36 0.14 Tg C yr?1 as CO2 to the atmosphere, equivalent to 6% of the DIC flux (5.76 Tg C yr?1) from the Zhujiang River estuary to the SCS (Guo X et al., 2008, 2009).
The limited data from the Huanghe River estuary suggests surface water pCO2 is lower than both the Changjiang and Zhujiang river estuaries. pCO2 ranged from 380–700 atm in May and September of 2009 (Liu et al., 2014). If the same air-sea exchange rate as the Changjiang inner estuary is taken (~8 cm h?1; Zhai et al., 2007), the estimated air-sea CO2 flux in the Huanghe River estuary is 4.2 mol m?2 yr?1. Assuming a surface area of 35 km2, the Yellow River estuary emits 0.002 0.001 Tg C yr?1 as CO2 to the atmosphere.
The area-weighted air-sea CO2 flux of the above three estuaries is 9.19 mol C m?2 yr?1. The total area of the other 38 estuaries discharging into the China Seas, such as the Hanjiang, Qinjiang and Minjiang, is 670 km2 (determined as the area of the channel from the estuary mouth to 20 km upstream). If 9.19 mol C m?2 yr?1 is taken as the average CO2 flux in the estuaries, the 38 estuaries (excluding the three large river estuaries) emit 0.07 Tg C yr?1 of CO to the at-highly human perturbed downstream tributary of the Changjiang flowing through Shanghai, was higher, ranging from 1000–4600 atm (Zhai et al., 2007). In the estuarine mixing zone, pCO2 ranged from 200–1000 atm (Zhai et al., 2007). The inner Changjiang estuary (121 –122 E, exclud- ing the Huangpu River and waters around Shanghai) emitted15.5 mol m–2 yr–1 CO2 to the atmosphere (Zhai et al., 2007), which is equivalent to 0.30 0.11 Tg C yr?1 (over a surface area of 1600 km2), or 1.6% of the DIC flux to the ECS from the Changjiang River (18.48 Tg C yr?1; Zhai et al., 2007).
The Zhujiang River estuary consists of three sub-estuaries: the Lingdingyang, Modaomen, and Huangmaohai. The Lingdingyang is surrounded by large metropolitan areas such as Guangzhou and Hong Kong. Surface water pCO2 in the upper Lingdingyang reached as high as 8000 atm, much higher than the other two sub-estuaries (<2000 atm; Guo X et al., 2009). The high pCO2 in the upper Lingdingyang is mainly attributed to strong aerobic respiration and nitrifica- tion (Dai et al., 2006, 2008). pCO2 spatial distribution is dominated by mixing between high-pCO2 estuarine water and low-pCO2 seawater in the mid Lingdingyang, though the magnitude is controlled by net community production (NCP)mosphere. In total, China’s estuaries emit 0.74 0.18 Tg C yr?1 of CO2 to the atmosphere (Figure 4).
2.3POC export flux
POC export flux is considered to be equivalent to NCP under steady state conditions (Cai et al., 2008). It is typically used to evaluate the efficiency of the biological production, which greatly modulates the CO2 level in the atmosphere. There are several methods to quantify POC export flux, including but not limited to: sediment trap deployment (Chen et al., 1998; Ho et al., 2009), 234Th/238U, 210Pb/226Ra, and 210Po/210Pb disequilibria (Wei et al., 2011; Chen et al., 2008; Cai et al., 2008, 2015), 228Ra/NO3 modeling (Nozaki and Yamamoto, 2001), carbon budgeting (Chou et al., 2006), and 15N tracer- based new production (Dugdale and Wilkerson, 1986). Among them, the last three methods measure the POC fluxes indirectly. Subsequently, they can induce discrepancies when compared with the direct methods on a temporal scale. Thus, we only discussed the results from sediment trap and radiochemistry methodologies, which measure the flux di- rectly and focus on the fluxes in the euphotic zone.
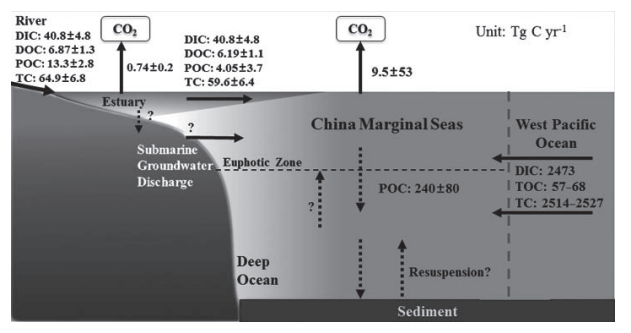
Figure 4 Carbon fluxes in the China Seas (unit: Tg C yr?1). Quantified fluxes across interfaces include air-sea CO2 fluxes in the China Seas, carbon fluxes (DIC, DOC, POC, TC) from rivers to estuaries and from estuaries to the China Seas, air-sea CO2 fluxes in Chinese estuaries, POC export fluxes from upper China Seas, and net carbon (DIC, TOC, and TC) fluxes from the West Pacific Ocean to the marginal seas. The carbon fluxes associated with submarine groundwater discharge, sediment burial, and transport into the euphotic layer through diffusion or upwelling are very limited and have not been quantified. The annual average air-sea CO2 flux in each marginal sea is derived from the product of the air-sea CO2 flux per unit area from the literature (the references are presented in the caption of Figure 3 and the text) and the total surface area of the marginal sea. The China Seas are a net CO2 source to the atmosphere, with the degassing CO2 flux estimated to be 9.5 53 Tg C yr?1. The reported error represents spatial and temporal variations in CO2 fluxes. Riverine carbon fluxes into the estuaries and China Seas are presented in Table 1 and the text in detail. It should be noted that riverine carbon fluxes into the estuaries exclude the estuaries outside of Chinese borders. In addition, we do not consider Beibu Bay and the Gulf of Thailand when calculating the area of the South China Sea (SCS), and we neglect the carbon exchange fluxes between the SCS and Beibu Bay as well as the Gulf of Thailand. We also do not consider the carbon export from the SCS to the Mindoro Strait and the Karimata Strait.
2.3.1South China Sea
Large variations in POC fluxes in the SCS were observed via different methodologies. On the northern SCS shelf, POC fluxes were mainly derived from 234Th/238U disequilibria. Chen (2008) reported the POC flux, as ranging from 5.3–26.6 mmol C m?2 d?1 with an average of 15 4.6 mmol C m?2 d?1. Cai et al. (2015) re-evaluated the POC flux in the same region as Chen (2008) based on high spatial resolution sampling. They reported POC fluxes ranging from 4.6–66.7 mmol C m?2 d?1, with an average of 25 1.7 mmol C m?2 d?1. In the SCS basin, the POC flux was 9.6–21 mmol C m?2 d?1 based on 234Th/238U disequilibria, 1.8–20 mmol C m?2 d?1 based on 210Po/210Pb disequilibria, and 7.2–21 mmol C m?2 d?1 based on 210Pb/226Ra dis- equilibria (Wei et al., 2011; Yang et al., 2009). The POC flux derived from sediment traps is 9.8–18.5 mmol C m?2 d?1 (Ho et al., 2009). Summing the values above, the average POC flux was 14.4 3.6 mmol C m?2 d?1. For now, the most comprehensive and highest resolution POC flux values in the northern SCS basin were measured by Cai et al. (2015), and range from 0.8–16.2 mmol C m?2 d?1. Therefore, the total observed range of POC fluxes is 0.8–21 mmol C m?2 d?1, with an average of 8.7 3.6 mmol C m?2 d?1. From the few measurements carried out in the southern SCS basin, the POC flux is approximately 1.7–5.7 mmol C m?2 d?1 based on both 234Th/238U and 228Th/228Ra disequilibria (Cai et al., 2002). Cai et al. (2008) pointed out that the spatial variability in POC fluxes is significant, and the average POC flux was 3.8 4.0 mmol C m?2 d?1 in the southern SCS basin. In gen-eral, the POC flux was observed to be higher in the shelf region compared to the basin. Considering seasonal varia- tion, the POC fluxes in the SCS are highest in winter but comparable during other seasons (Wei et al., 2011; Chen, 2008; Cai et al., 2015). Additionally, inter-annual variability may be impacted by ENSO (Li et al., 2017).
The e-ratio (export production to primary production) is typically used to measure the efficiency of the biological pump within a particular area. Although the SCS is oligo- trophic, its e-ratio is generally >10%, higher than other subtropical oceans (Wei et al., 2011; Chen et al., 2008). Thus, the efficiency of the biological pump in the SCS is relatively high compared with open ocean. It is proposed that the ex- port fluxes from the euphotic zone of the SCS are mainly controlled by POC stocks, and that export efficiency is po- sitively correlated with diatom abundance, indicating that community structure is important in modulating the down- ward export of material in the SCS (Cai et al., 2015).
2.3.2East China Sea and Yellow Sea
In the ECS and YS, where the water depths in most regions are shallow (<100 m), diapycnal mixing could reach to the sea bottom under the influence of the northeast monsoon and may last for >3 months. Therefore, intense re-suspension in these two marginal seas creates difficulties in estimating POC fluxes (Dai et al., 2013b). Hung et al. (2013) estimated net POC fluxes of 24.7–65.4, 5.7, and 4.8 mmol C m?2 d?1 respectively on the inner, mid, and outer shelf, using a simple model to deduct the contribution from re-suspension. In shallow water (38–88 m) and deep water (118–154 m) re- gions, the re-suspension ratio could be 57–93% and 27–58%, respectively (Hung et al., 2013; Guo et al., 2010). Based on 234Th/238U disequilibria, Zhou (2009) estimated that net POC fluxes in the YS vary within 26.4–52 mmol C m?2 d?1, with an average of 37.3 0.9 mmol C m?2 d?1. Using floating se- diment traps and similar methodology, Zhang et al. (2005) determined POC fluxes of 16 mmol C m?2 d?1 during the fall and 24.2 3.3 mmol C m?2 d?1 during the summer (Zhang et al., 2004). Consequently, the average POC flux in the YS was 20.1 4.2 mmol C m?2 d?1, and the re-suspension flux reached 16.9 mmol C m?2 d?1.
Synthesizing all data presented above, the POC export flux increases with decreasing water depth. POC export fluxes are 20 9.8 mmol C m?2 d?1 on the SCS shelf, 5.4 2.5 mmol C m?2 d?1 in the SCS basin, 24.6 22.5 mmol C m?2 d?1 in the ECS, and 29.2 11.5 mmol C m?2 d?1 in the YS. This regional trend, SCS<ES<YS, may be caused by the decreased re- mineralization rate in the YS due to its shallow depth and the large cell diatom dominated community structure. By con- sidering the surface area of the three seas, we determined that annual POC fluxes are 110 40 Tg C yr?1 in the SCS, 80 70 Tg C yr?1 in the ECS and 50 20 Tg C yr?1 in the YS. In summary, the total POC flux in the three China Seas is 240 80 Tg C yr?1.
2.4Exchange with the Pacific Ocean
Marginal seas are subject to complex material and energy exchanges with the open ocean. For instance, material ex- changes between the north Atlantic Ocean and the Caribbean Sea, Gulf of Mexico, and North Sea, significantly affect the carbon fluxes in these marginal seas (Thomas et al., 2005). Meanwhile, marginal seas are characterized by higher rates of biological activities such as primary productivity, pro- viding material sources to the open ocean. For instance, Liu et al. (2000) stated that marginal seas transport a consider- able amount of organic carbon to the open ocean; up to 2 Pg C yr?1. Given the high temporal and spatial variability of the exchange between marginal seas and the open ocean, it is difficult to accurately define the material exchange both from observation and simulation, thus becoming a challen- ging scientific question (Doney, 2010).
With the Kuroshio acting as a link, the Northwest Pacific Ocean-East Asian marginal sea is the most unique open ocean-ocean margin system. Water, energy, and material exchanges between these systems, significantly influence the Northwest Pacific Ocean (NWP) and its adjacent marginal seas (Chen and Wang, 1999; Chen et al., 2006; Chou et al., 2007; Cao and Dai, 2011; Dai et al., 2009; Sheu et al., 2009; Wu et al., 2015; Lu et al., 2015). Chen and Wang (1999) estimated the contribution of the Kuroshio to the nutrientbudget in the ECS, and they concluded that the phosphate in the ECS primarily originated from the intrusion of Kuroshio intermediate water.
The annual flux of DOC transported from the ECS to the NWP is between 2–12 Tg C yr?1 (Chen and Wang, 1999; Liu et al., 2006, 2010b). The POC outflow flux from the ECS to the adjacent NWP is 0.25 Tg C yr?1. Based on a carbon budget model for the ECS, the DOC, and DIC fluxes from the ECS to the adjacent NWP are estimated to be 50–63 Tg C yr?1 (Deng et al., 2006).
The Luzon Strait is a major deep-water channel, allowing exchange between the SCS and the NWP. This exchange is characterized as a “sandwich-like” structure with an inflow from the NWP in the upper and deep layers, and an outflow to the NWP in the intermediate layer (Chao et al., 1996; Gan et al., 2006; Li and Qu, 2006; Qu et al., 2006; Tian et al., 2006). The continuously-replenished deep water in the SCS, originating from the NWP, achieves water balance through the rapid ventilation and persistent net intermediate water outflow (Chao et al., 1996; Li and Qu, 2006). This process can be observed by examining the distribution of TOC (total organic carbon), as an example. The TOC concentration in the upper 200 m of the SCS is lower than that in the NWP. SCS intermediate water (1000–1500 m) has relatively higher TOC values, and SCS TOC concentrations at depths>2000 m are comparable with the NWP deep water (Dai et al., 2009; Wu et al., 2015). Combining the water exchange fluxes and TOC concentrations, we determined that the TOC transport fluxes in the upper, intermediate, and deep layers of the SCS to be ?107.1 54.6, 54.7 15.0, and?16.4 13.1 Tg C yr?1, respectively (positive values refer to transport from the SCS to the NWP). The net TOC output is?68.8 58.0 Tg C yr?1. Using this calculation methodology, we also find the exchange fluxes of other materials through the Luzon Strait. The net influxes of DIC, total alkalinity (TA), and Ca2+ to the SCS are 2.5 Pg C yr?1, 2.8 Pg C yr?1, and 40 Pg Ca yr?1. The net fluxes of dissolved inorganic nitrogen (DIN), dissolved inorganic phosphorus (DIP), and dissolved silicates (DSi) to the NWP are 7 Tg N yr?1,4.65 Tg P yr?1, and 137.2 Tg Si yr?1, respectively. The DIC flux transported to the SCS through the deep layer is as high as 984 Tg C yr?1. Together, the total amount of carbon transported from the NWP to the SCS and ECS is2.5 Pg C yr?1. Given the different C:N:P:Si ratios between the SCS and the NWP, their exchange could result in a sig- nificant influence on the biogeochemical cycles of carbon and associated biogenic elements in both the SCS and NPW. It should be noted that the above flux estimates may have large uncertainties due to limited datasets. In addition, we did not consider carbon export from the SCS via the Mindoro and Karimata straits, and carbon exchanges between the SCS
and the Beibu Gulf and Gulf of Thailand.
3.A comparison between the China Seas and other world marginal seas
According to physical-biogeochemical characteristics, the marginal seas can be classified into several provinces (Cai et al., 2006; Dai et al., 2013a). The mid-latitude (30 –60 ) non- upwelling marginal seas possess characteristics of a broad shelf; seasonal stratification without strong coastal upwel- ling. These marginal seas can be further classified into two types: the eutrophic shelves that receive substantial anthro- pogenic nutrients, and the mesotrophic shelves that receive relatively less terrestrially-derived nutrients (Cai et al., 2006; Dai et al., 2013a). The former include the Mid Atlantic Bight (absorbing 2.65 Tg C yr?1 of CO ; Cai et al., 2006; De- Grandpre et al., 2002), the Baltic Sea (absorbing
4.21 Tg C yr?1; Thomas and Schneider, 1999), the Sea of Japan (absorbing 29.6 Tg C yr?1 of CO2; Choi et al., 2012; Kang et al., 2010), the North Sea (absorbing 8.46 Tg C yr?1 of CO2; Thomas et al., 2004), and the Mediterranean Sea shelf (absorbing 3.51 Tg C yr?1 of CO2; B govic and Copin- Mont gut, 2002; Borges et al., 2006; Copin-Mont gut et al., 2004). Overall, eutrophic shelves in the mid-latitude non- upwelling marginal seas absorbed 81.7 Tg C yr?1 of CO2 from atmosphere (Dai et al., 2013). Examples of mesotrophic shelves are the Bering Sea shelf (absorbing 23.8 Tg C yr?1 of CO2; Bates et al., 2011), the Patagonian Sea in South America (absorbing 16.2 Tg C yr?1 of CO ; Bianchi et al., 2009), and the Gulf of Maine (releasing 0.46 Tg C yr?1 of CO2 to atmosphere; Vandemark et al., 2011). This type of shelf absorbed 168.2 Tg C yr?1 of CO2 from atmosphere (Dai et al., 2013a).
Although the low-latitude (0 –30 ) western boundary shelves are also characterized by non-upwelling, the CO2 fluxes are different from mid-latitude marginal seas. These low latitude western marginal seas feature high temperatures and large riverine inputs of both inorganic and organic car- bon. As a whole, this type of marginal sea was a CO2 source of 29.8 Tg C yr?1 (Dai et al., 2013a). Examples of low-lati- tude marginal seas include the Brazil shelf (releasing
11.5 Tg C yr?1 of CO ; Ito et al., 2005) and the west Florida shelf (releasing 4.28 Tg C yr?1 of CO2; Cai et al., 2006).
The eastern boundary marginal seas are also classified into two types: the low-latitude and mid-latitude marginal seas. The eastern boundary marginal seas are usually character- ized by narrow shelves and coastal upwelling. The low-la- titude upwelling systems are typically CO2 sources due mainly to both high temperatures and upwelling. This type of marginal sea acted as a CO2 source of 53.1 Tg C yr?1 (Dai et al., 2013a). Examples of low-latitude upwelling systems include the Peruvian upwelling system (releasing
54.7 Tg C yr?1 of CO2 to atmosphere; Friederich et al., 2008) and the Chilean upwelling system (releasing 1.94 Tg C yr?1 of CO2; Torres et al., 2003, 2011). The CO2 sources of the
mid-latitude upwelling systems are much weaker than those of the low-latitude upwelling systems and show larger seasonal variability. These marginal seas released
11.8 Tg C yr?1 of CO2 to atmosphere (Dai et al., 2013a). Examples of mid-latitude upwelling systems include up- welling off the coast of California (releasing 2.70 Tg C yr?1 of CO2; Friederich et al., 2002; Hales et al., 2005), and the southern Bering Sea slope (releasing 16.4 Tg C yr?1 of CO2; Fransson et al., 2006). Although the mid-latitude upwelling systems are usually CO2 sources, the Oregon shelf (absorb- ing 4.36 Tg C yr?1; Evans et al., 2011) and the western Ca- nadian coast (absorbing 1.55 Tg C yr?1 of CO2; Evans et al., 2012) are CO2 sinks.
High-latitude (60 –90 ) marginal seas are also called phototrophic marginal seas, as primary production in these regions is usually limited by the weak light availability. Although receiving a large amount of riverine inputs of or- ganic carbon, the phototrophic-Arctic marginal seas are a CO2 sink due to the low temperatures (?202.5 Tg C yr?1; Dai et al., 2013a). The Greenland-Norwegian Seas (absorbing
118.8 Tg C yr?1 of CO2 from atmosphere; Anderson et al., 2000; Hood et al., 1999; Nakaoka et al., 2006; Skjelvan et al., 1999; Slagstad et al., 1999), the Barents Sea (absorbing
68.0 Tg C yr?1 of CO2; Nakaoka et al., 2006; Omar et al., 2007), and the Chukchi Sea (absorbing 9.65 Tg C yr?1 of CO2; Arrigo et al., 2010; Bates, 2006; Gao et al., 2012; Semiletov et al., 2007) are examples of this type of marginal sea. The Antarctic marginal seas were also a CO2 sink of
5.3 Tg C yr?1 because of low temperatures, although they are also influenced by upwelling (Dai et al., 2013a and refer- ences therein).
As for the China Seas, the YS and the ECS are mid-latitude eutrophic shelves, and the SCS belongs to low-latitude western boundary shelves.
4.Future research
4.1Long-term observations
Although a large number of regional observations of carbon fluxes have been conducted over the last 20 years, large uncertainties remain in evaluating the air-sea CO2 fluxes in the China Seas. In the BS and the NYS, the CO2 source-sink patterns are still quite uncertain. Even though the basic source-sink patterns of CO2 have been determined in the SCS and ECS, the temporal and spatial resolution remain in- sufficient mainly due to a lack of long-term time-series ob- servations.
Current estimates of air-sea CO2 fluxes are generally based on measurements of pCO2 disparity (the difference between surface water pCO2 and atmospheric pCO2). Given that at- mospheric pCO2 is relatively homogeneous and constant, theaccurate measurement of surface water pCO2 thus becomes the determining factor for estimating the air-sea CO2 flux (Wang et al., 2014). Calculated average surface water pCO2 estimates are usually based on gridded pCO2 data. The un- certainties in the gridded pCO2 data mainly originate from three sources (Wang et al., 2014): (1) analytical error in the pCO2 measurement, (2) spatial variance, and (3) the bias resulting from under-sampling. Analytical error in surface water pCO2 can be controlled within 1%, making the un- certainty of the CO2 flux mainly related to (2) and (3). Wang et al. (2014) developed a method to quantitatively estimate the three uncertainties in surface water pCO2 gridded data using both observational and remote sensing data. They found that spatial variances of surface water pCO2 were the dominant source of uncertainty on the ECS shelf during summer. Thus, identifying and quantifying the sources of uncertainty for pCO2 gridded data are essential for accurately estimating the air-sea CO2 fluxes and the ocean’s carbon budget. It should be noted that the inherent spatial variance cannot be reduced by increasing the observation frequency, but it is useful to identify different sources of uncertainty in planning the spatial and temporal resolution of observations. It is a huge challenge to precisely predict the changes in the Earth’s climate system and carbon cycle at both regional and global dimensions across different time-scales (e.g., from annual to decadal scales). However, little is known about the carbon cycle in the China Seas over these timescales. Taking the Changjiang River estuary as an example, Chou et al. (2013) reported that the surface water pCO2 during summer showed a decreasing trend from the 1990s to 2000s. They attributed this trend to the increasing biological DIC uptake as a result of enhanced photosynthesis via eutrophication. Moreover, the CO2 sink during winter for the inner shelf of ECS near the Changjiang estuary has decreased due to global warming (Chou et al., 2013). However, this statement needsto be further validated by long-term observations.
Remote sensing is a critically important tool in improving the spatial and temporal coverage of surface water pCO2 ob- servations. As such, many efforts have been made to estimate sea surface pCO2 and air-sea CO2 fluxes from space by de- veloping empirical relationships between pCO2 and satellite- derived parameters (Jo et al., 2012 and references therein). Bai et al. (2015) proposed a ‘‘mechanistic semi-analytic algo- rithm’’ (MeSAA) to estimate sea surface pCO2 in river- dominated coastal oceans using satellite data. Observed pCO2 can be analytically expressed as the sum of individual com- ponents contributed by major factors such as thermodynamics, water mass mixing, and biological processes. It must be pointed out that applications of these approaches to marginal seas worldwide remain challenging due to the high spatio- temporal variations and their intrinsic controls in both physics and biogeochemistry in different marginal seas.
4.2Towards a conceptual framework of marginal sea carbon cycling
Currently, there are still difficulties in reliably simulating biogeochemical processes and carbon cycling in marginal seas using numerical models. Dai et al. (2013a) developed an alternative approach by coupling physical and biogeochem- ical processes, and carbon and nutrients in attempting to build up a semi-quantitative diagnostic method and a con- ceptual framework of marginal sea carbon cycling. The complexity in simulating marginal sea carbon cycling is owed to its modulation by both terrestrial inputs and their exchanges with the open ocean. Therefore, the carbon cycle in marginal seas is a function of both exogenous inputs (terrestrial inputs and exchange with the open ocean) and internal processes (thermodynamic and the biological pump). The net CO2 sink/source term in a marginal sea is dependent on the balance between the relative external contribution of DIC and nutrients to the upper layer, as well as biogeochemical consumption therein. OceMar was vali- dated in the SCS, the Caribbean Sea, and the upwelling system off the coast of California (Dai et al., 2013a; Cao et al., 2014). Recently, Chou et al. (2017) also verified OceMar in the Peter the Great Bay, located in the northern Sea of Japan. It should be pointed out that this method is based on the assumption of steady state conditions; i.e. the time-scale of the mixing of water masses is the same or similar with that of the biogeochemical processes (see details in Dai et al., 2013a and Cao et al., 2014).
4.3Carbon fluxes and mechanisms across the land-sea aquatic continuum
As previously stated, marginal seas are located in transitional zones between land and open ocean. These regions involve complex, dynamic, and multi-scale processes. Here we ad- dress two aspects that are not well-constrained on the role of the land-sea transition zone in the China Seas carbon cycle.
4.3.1Submarine groundwater discharge (SGD)
Over the last two decades, in addition to rivers, SGD has been identified as a critical component of the land-sea in- teractions. Also, subterranean estuaries (STE) constitutes another “reactor” in this transition zone (Moore, 1999). Groundwater is often enriched in organic carbon. For ex- ample, in a STE in the Gulf of Mexico, the terrestrial groundwater associated DOC flux was equivalent to 25% of the total DOC inputs to the adjacent coastal ocean (Santos et al., 2009). Based on a limited dataset, SGD provided 11–22 Tg C yr?1 of DOC to the coastal ocean globally (Dai et al., 2012). However, SGD-derived DOC fluxes to the China estuaries and adjacent marginal seas have not yet been re- ported. Moreover, pCO2 is generally elevated in the regionalgroundwater by approximately three orders of magnitude above atmospheric pCO2 (Gagan et al., 2002; Cai et al., 2003), suggesting SGD is an important DIC source to the coastal ocean (Liu Q et al., 2014; Sadat-Noori et al., 2016). For instance, the SGD-DIC flux to the northern SCS shelf during summer accounts for 23–53% of the DIC flux sup- plied by the Zhujiang River (Liu et al., 2012), and SGD may have a significant impact on the carbonate system in the shelf waters. The DIC flux delivered by SGD to the Jiulong River estuary is equivalent to 45–110% of the contribution from the Jiulong River (Wang et al., 2015). Consequently, SGD as a source of terrestrial carbon, is often overlooked and should be considered in the carbon budget at a regional or global scale in the future.
4.3.2Coastal wetlands
Wetland ecosystems are characterized by high rates of pri- mary productivity with slow organic matter decomposition. The carbon burial flux in this system has been estimated to be as high as 100 Tg C yr?1 globally (Hopkinson et al., 2012). As a large “blue carbon” sink, their impact on the global carbon cycle has become an important topic in recent years (Sutula et al., 2003; S?vik and Kl?ve, 2007; Zhang et al., 2008; Sanders et al., 2016). China has the largest wetland area in Asia with a total area of 3.85 107 km2 (Duan et al., 2008) and a coastal wetland area of ~5.94 104 km2 (Cao et al., 2013). Current studies have shown that the burial rate of organic carbon in various types of swamp wetlands (peat- land, freshwater marsh, inland salt marsh, coastal salt marsh, and forest wetland) in China is 4.91 Tg C yr?1 (Duan et al., 2008). The highest carbon sequestration rate (CSR) in the wetlands can be found in mangroves and coastal salt marshes (Alongi, 2014). Coastal wetlands are extremely complex ecosystems with respect to carbon fluxes. Wetland vegeta- tion can absorb atmospheric CO2 via photosynthesis, and vegetation litter forms peat and humus as it becomes part of the soil. While some of the carbon is buried in the soil, a large portion is also re-released as CO2 and CH4 into the atmo- sphere through respiration. The remaining carbon discharges into the ocean by lateral transport through surface and sub- terranean estuaries, which significantly affects the marine carbon cycle.
In recognition of the critical importance of wetland eco- systems in global carbon sequestration, many studies focus on the evaluation of CSR, which is estimated based on se- dimentation rates and total organic carbon content of the soil (Alongi, 2014; Alongi et al., 2005; Liu H et al., 2014). This evaluation is based on the assumption that these soils solely fix atmospheric CO2. However, coastal wetland systems could also be affected by lateral transport at the surface and through roundwater/porewater exchange. In other words, currently estimated CSRs and carbon sequestration capa- cities may include carbon both fixed from the atmosphereand from lateral transport. Bouillon et al. (2008) and Alongi (2009) observed an imbalance between carbon sources and sinks in mangrove systems globally, and a missing carbon sink that reaches up to 110 Tg C yr?1. While the mechanisms behind these imbalances are still unclear, it remains a pos- sibility that all the imports and exports of carbon within these systems are not fully considered, particularly the lateral transport of DIC resulting from surface and porewater ex- change (Maher et al., 2013; Alongi, 2014). Recently, based on scaling measurements from a few mangrove systems in Australia, Sippo et al. (2017) estimated that the lateral DIC flux in mangrove systems globally was 43 12 Tg C yr?1. This estimate accounts for one-third of the missing carbon sinks. Therefore, lateral transport could be an important carbon sink in coastal wetland systems and may also impact the coastal ocean carbon cycle. Yet, its accurate quantifica- tion is still very challenging and accurate estimates are scarce. In China, systematic studies of carbon storage and cycling have been only carried out on tidal flat wetlands in the Changjiang estuary (Alongi et al., 1999, 2005; Cheng et al., 2010; Guo H Q et al., 2009). Thus, it is premature to comprehensively evaluate the contribution of coastal wet- lands to the regional carbon cycle in China. As such, it re- mains urgent to strengthen research on the carbon budget of coastal wetland systems in the future.
4.4Perturbation of the carbon cycle in marginal seas
The effect of human activities on the ocean’s carbon cycle has been a hot topic in recent years. However, the driving forces are complex and variable (Le Qu r et al., 2017; Regnier et al., 2013). Since marginal seas are located where the land, ocean, and atmosphere interact, human activities can affect all three spheres. For example, in the terrestrial environment, human activities (including the change of land use patterns, embankment construction, wastewater dis- charge, and marsh dredging) are changing or have changed carbon sources, cycling and budgets in estuaries. Subse- quently, this has resulted in variations of riverine carbon fluxes to the ocean (Regnier et al., 2013). In addition, agri- cultural activities and land use change largely enhance the nutrient inputs to rivers. This in turn, increases primary productivity and the accumulation of organic carbon in es- tuaries and the continental shelf. This creates a situation, where consumption of oxygen as organic carbon is degraded, with the transpiration of subsequent exacerbations of hy- poxic events and ocean acidification (Cai et al., 2011; Doney, 2010; Wang et al., 2016).
Acknowledgements We are grateful to Dr. Zhiqiang Liu (Hong Kong University of Science and Technology) for calculating the area of 38 estuaries and Yan Yang for references compiling. This research was sup- ported by the National Natural Science Foundation of China (Grant Nos.
91328202 & 91428308), the Major Scientific Research Program of the Ministry of Science and Technology (Grant No. 2015CB954001), the Marine Public Welfare Project of the State Oceanic Administration (Grant No. 201505003-3), and the Global Change Program (Grant No. GASI-03- 01-02-02).
References
Alongi D M. 2009. The Energetics of Mangrove Forests. New York: Springer. 216
Alongi D M. 2014. Carbon cycling and storage in mangrove forests. Annu Rev Mar Sci, 6: 195–219
Alongi D M, Tirendi F, Dixon P, Trott L A, Brunskill G J. 1999. Miner- alization of organic matter in intertidal sediments of a tropical semi- enclosed delta. Estuar Coast Shelf Sci, 48: 451–467
Alongi D M, Pfitzner J, Trott L A, Tirendi F, Dixon P, Klumpp D W. 2005. Rapid sediment accumulation and microbial mineralization in forests of the mangrove Kandelia candel in the Jiulongjiang Estuary, China. Es- tuar Coast Shelf Sci, 63: 605–618
Anderson L G, Drange H, Chierici M, Fransson A, Johannessen T, Skjelvan I, Rey F. 2000. Annual carbon fluxes in the upper Greenland Sea based on measurements and a box-model approach. Tellus Ser B-Chem Phys Meteorol, 52: 1013–1024
Arrigo K R, Pabi S, van Dijken G L, Maslowski W. 2010. Air-sea flux of CO2 in the Arctic Ocean, 1998–2003. J Geophys Res, 115: G04024
Bai Y, Cai W J, He X, Zhai W, Pan D, Dai M, Yu P. 2015. A mechanistic semi-analytical method for remotely sensing sea surface pCO2 in river- dominated coastal oceans: A case study from the East China Sea. J Geophys Res, 120: 2331–2349
Bates N R. 2006. Air-sea CO2 fluxes and the continental shelf pump of carbon in the Chukchi Sea adjacent to the Arctic Ocean. J Geophys Res, 111: C10013
Bates N, Cai W J, Mathis J. 2011. The ocean carbon cycle in the western Arctic Ocean: Distributions and air-sea fluxes of carbon dioxide. Oceanography, 24: 186–201
B govic M, Copin-Mont gut C. 2002. Processes controlling annual varia- tions in the partial pressure of CO2 in surface waters of the central northwestern Mediterranean Sea (Dyfamed site). Deep-Sea Res Part II- Top Stud Oceanogr, 49: 2031–2047
Bianchi A A, Pino D R, Perlender H G I, Osiroff A P, Segura V, Lutz V, Clara M L, Balestrini C F, Piola A R. 2009. Annual balance and sea- sonal variability of sea-air CO2 fluxes in the Patagonia Sea: Their re- lationship with fronts and chlorophyll distribution. J Geophys Res, 114: C03018
Borges A V. 2011. Present day carbon dioxide fluxes in the coastal ocean and possible feedbacks under global change. In: Duarte P, Santana- Casiano J M, eds. Oceans and the Atmospheric Carbon Content. Dor- drecht: Springer. 47–77
Borges A V, Delille B, Frankignoulle M. 2005. Budgeting sinks and sources of CO2 in the coastal ocean: Diversity of ecosystems counts. Geophys Res Lett, 32: L14601
Borges A V, Schiettecatte L S, Abril G, Delille B, Gazeau F. 2006. Carbon dioxide in European coastal waters. Estuar Coast Shelf Sci, 70: 375–387 Bouillon S, Borges A V, Casta?eda-Moya E, Diele K, Dittmar T, Duke N C, Kristensen E, Lee S Y, Marchand C, Middelburg J J, Rivera-Monroy
V H, Smith Iii T J, Twilley R R. 2008. Mangrove production and carbon sinks: A revision of global budget estimates. Glob Biogeochem Cycle, 22: GB2013
Canadell J G, Ciais P, Dhakal S, Dolman H, Friedlingstein P, Gurney K R, Held A, Jackson R B, Le Qu r C, Malone E L, Ojima D S, Patwardhan A, Peters G P, Raupach M R. 2010. Interactions of the carbon cycle, human activity, and the climate system: A research portfolio. Curr Opin Environ Sustainability, 2: 301–311
Cai P, Chen W, Dai M, Wan Z, Wang D, Li Q, Tang T, Lv D. 2008. A high- resolution study of particle export in the southern South China Sea based on 234Th:238U disequilibrium. J Geophys Res, 113: C04019
Cai P, Huang Y, Chen M, Guo L, Liu G, Qiu Y. 2002. New production based on 228Ra-derived nutrient budgets and thorium-estimated POC export at the intercalibration station in the South China Sea. Deep-Sea Res Part I-Oceanogr Res Pap, 49: 53–66
Cai P, Zhao D, Wang L, Huang B, Dai M. 2015. Role of particle stock and phytoplankton community structure in regulating particulate organic carbon export in a large marginal sea. J Geophys Res, 120: 2063–2095 Cai W J. 2011. Estuarine and coastal ocean carbon paradox: CO2 sinks or sites of terrestrial carbon incineration? Annu Rev Mar Sci, 3: 123–145 Cai W J, Dai M. 2004. Comment on “enhanced open ocean storage of CO2
from shelf sea pumping”. Science, 306: 1477c
Cai W J, Dai M, Wang Y. 2006. Air-sea exchange of carbon dioxide in ocean margins: A province-based synthesis. Geophys Res Lett, 33: L12603
Cai W J, Hu X, Huang W J, Murrell M C, Lehrter J C, Lohrenz S E, Chou W C, Zhai W, Hollibaugh J T, Wang Y, Zhao P, Guo X, Gundersen K, Dai M, Gong G C. 2011. Acidification of subsurface coastal waters enhanced by eutrophication. Nat Geosci, 4: 766–770
Cai W J, Wang Y, Krest J, Moore W S. 2003. The geochemistry of dis- solved inorganic carbon in a surficial groundwater aquifer in North Inlet, South Carolina, and the carbon fluxes to the coastal ocean. Geochim Cosmochim Acta, 67: 631–639
Cao L, Song J, Li X, Yuan H, Li N, Duan L. 2013. Research progresses in carbon budget and carbon cycle of the coastal salt marshes in China (in Chinese). Acta Ecol Sin, 33: 5141–5152
Cao Z, Dai M. 2011. Shallow-depth CaCO3 dissolution: Evidence from excess calcium in the South China Sea and its export to the Pacific Ocean. Glob Biogeochem Cycle, 25: GB2019
Cao Z, Dai M, Evans W, Gan J, Feely R. 2014. Diagnosing CO2 fluxes in the upwelling system off the Oregon-California coast. Biogeosciences, 11: 6341–6354
Chao S Y, Shaw P T, Wu S Y. 1996. Deep water ventilation in the South China Sea. Deep-Sea Res Part I-Oceanogr Res Pap, 43: 445–466
Chen C T A, Borges A V. 2009. Reconciling opposing views on carbon cycling in the coastal ocean: Continental shelves as sinks and near-shore ecosystems as sources of atmospheric CO2. Deep-Sea Res Part II-Top Stud Oceanogr, 56: 578–590
Chen C T A, Huang T H, Chen Y C, Bai Y, He X, Kang Y. 2013. Air-sea exchanges of CO2 in the world’s coastal seas. Biogeosciences, 10: 6509–6544
Chen C T A, Wang S L. 1999. Carbon, alkalinity and nutrient budgets on the East China Sea continental shelf. J Geophys Res, 104: 20675–20686 Chen C T A, Wang S L, Chou W C, Sheu D D. 2006. Carbonate chemistry and projected future changes in pH and CaCO3 saturation state of the
South China Sea. Mar Chem, 101: 277–305
Chen J, Zheng L, Wiesner M G, Chen R, Zheng Y, Wong H K. 1998. Estimations of primary production and export production in the South China Sea based on sediment trap experiments. Chin Sci Bull, 43: 583– 586
Chen W. 2008. On the export fluxes, seasonality and controls of particulate organic carbon in the Northern South China Sea (in Chinese). Doctoral Dissertation. Xiamen: Xiamen University
Chen W, Cai P, Dai M, Wei J. 2008. 234Th/238U disequilibrium and parti- culate organic carbon export in the northern South China Sea. J Oceanogr, 64: 417–428
Cheng X L, Luo Y Q, Xu Q, Lin G H, Zhang Q F, Chen J K, Li B. 2010. Seasonal variation in CH4 emission and its 13C-isotopic signature from Spartina alterniflora and Scirpus mariqueter soils in an estuarine wetland. Plant Soil, 327: 85–94
Choi S H, Kim D, Shim J H, Kim K H, Min H S, Kim K R. 2012. Seasonal variations of surface fCO2 and sea-air CO2 fluxes in the Ulleung Basin of the East/Japan Sea. Terr Atmos Ocean Sci, 23: 343–353
Chou W C, Chen Y L L, Sheu D D, Shih Y Y, Han C A, Cho C L, Tseng C M, Yang Y J. 2006. Estimated net community production during the summertime at the SEATS time-series study site, northern South China Sea: Implications for nitrogen fixation. Geophys Res Lett, 33: L22610 Chou W C, Gong G C, Hung C C, Wu Y H. 2013. Carbonate mineral
saturation states in the East China Sea: Present conditions and future scenarios. Biogeosciences, 10: 6453–6467
Chou W C, Gong G C, Sheu D D, Hung C C, Tseng T F. 2009. Surface distributions of carbon chemistry parameters in the East China Sea in summer 2007. J Geophys Res, 114: C07026
Chou W C, Gong G C, Tseng C M, Sheu D D, Hung C C, Chang L P, Wang L W. 2011. The carbonate system in the East China Sea in winter. Mar Chem, 123: 44–55
Chou W C, Sheu D D D, Chen C T A, Wang S L, Tseng C M. 2005. Seasonal variability of carbon chemistry at the SEATS site, northern South China Sea between 2002 and 2003. Terr Atmos Ocean Sci, 16: 445–465
Chou W C, Sheu D D, Chen C T A, Wen L S, Yang Y, Wei C L. 2007. Transport of the South China Sea subsurface water outflow and its influence on carbon chemistry of Kuroshio waters off southeastern Taiwan. J Geophys Res, 112: C12008
Chou W C, Tishchenko P Y, Chuang K Y, Gong G C, Shkirnikova E M, Tishchenko P P. 2017. The contrasting behaviors of CO2 systems in river-dominated and ocean-dominated continental shelves: A case study in the East China Sea and the Peter the Great Bay of the Japan/East Sea in summer 2014. Mar Chem, 195: 50–60
Ciais P, Sabine C, Bala G, Bopp L, Brovkin V, Canadell J, Chhabra A, DeFries R, Galloway J, Heimann M, Jones C, Le Qu r C, Myneni R B, Piao S, Thornton P. 2013. Carbon and other biogeochemical cycles. In: Stocker T F, Qin D, Planttner G-K, Tignor M, Allen S K, Boschung J, Nauels A, Xia Y, Bex V, Midgley P M, eds. Climate Change 2013: The Physical Science Basis. Contribution of Working Group I to the Fifth Assessment Report of the Intergovernmental Panel on Climate Change. Cambridge: Cambridge University Press. 465–570
Copin-Mont gut C, B govic M, Merlivat L. 2004. Variability of the partial pressure of CO2 on diel to annual time scales in the Northwestern Mediterranean Sea. Mar Chem, 85: 169–189
Dai A. 2016. Historical and future changes in streamflow and continental runoff: A review. In: Tang Q, Oki T, eds. Terrestrial Water Cycle and Climate Change: Natural and Human-Induced Impacts, Geophysical Monograph 221. AGU: John Wiley & Sons. 17–37
Dai M, Yin Z. 2016. Marine carbon cycle. In: Chinese Academy of Sci- ences, ed. China Discipline Development Strategy: Marine Science (in Chinese). Beijing: Science Press. 199–221
Dai M, Cao Z, Guo X, Zhai W, Liu Z, Yin Z, Xu Y, Gan J, Hu J, Du C. 2013a. Why are some marginal seas sources of atmospheric CO2? Geophys Res Lett, 40: 2154–2158
Dai M, Guo X, Zhai W, Yuan L, Wang B, Wang L, Cai P, Tang T, Cai W J. 2006. Oxygen depletion in the upper reach of the Pearl River estuary during a winter drought. Mar Chem, 102: 159–169
Dai M, Meng F, Tang T, Kao S J, Lin J, Chen J, Huang-Chuan J, Tian J, Gan J, Yang S. 2009. Excess total organic carbon in the intermediate water of the South China Sea and its export to the North Pacific. Geochem Geophys Geosyst, 10: Q12002
Dai M, Wang L, Guo X, Zhai W, Li Q, He B, Kao S J. 2008. Nitrification and inorganic nitrogen distribution in a large perturbed river/estuarine system: The Pearl River Estuary, China. Biogeosciences, 5: 1227–1244 Dai M, Yin Z, Meng F, Liu Q, Cai W J. 2012. Spatial distribution of riverine DOC inputs to the ocean: an updated global synthesis. Curr
Opin Env Sust, 4: 170–178
Dai M, Zhai W, Lu Z, Cai P, Cai W J, Hong H. 2004. Regional studies of carbon cycles in China: Progress and perspectives (in Chinese). Adv Earth Sci, 19: 120–130
Dai M, Zhai W, Xu Y, Li Q, Han A, Zheng N, Zheng N, Zhou K, Meng F, Lin H, Guo X, Wang X. 2013b. Marine Chemistry. In: Wang Y, Liu R, Su J, eds. China Marine Geography (in Chinese). Beijing: Science Press. 194–244
DeGrandpre M D, Olbu G J, Beatty C M, Hammar T R. 2002. Air-sea CO2 fluxes on the US Middle Atlantic Bight. Deep-Sea Res Part II-Top Stud Oceanogr, 49: 4355–4367
Deng B, Zhang J, Wu Y. 2006. Recent sediment accumulation and carbon burial in the East China Sea. Glob Biogeochem Cycle, 20: GB3014
DeVries T, Holzer M, Primeau F. 2017. Recent increase in oceanic carbon uptake driven by weaker upper-ocean overturning. Nature, 542: 215– 218
Doney S C. 2010. The growing human footprint on coastal and open-ocean biogeochemistry. Science, 328: 1512–1516
Duan X, Wang X, Fei L, Ouyang Z. 2008. Primary evaluation of carbon sequestration potential of wetlands in China. Acta Ecol Sin, 28: 463– 469
Dugdale R C, Wilkerson F P. 1986. The use of 15N to measure nitrogen uptake in eutrophic oceans; experimental considerations. Limnol Oceanogr, 31: 673–689
Elderfield H. 2002. Climate change: Carbonate mysteries. Science, 296: 1618–1621
Evans W, Hales B, Strutton P G. 2011. Seasonal cycle of surface ocean
pCO2 on the Oregon shelf. J Geophys Res, 116: C05012
Evans W, Hales B, Strutton P G, Ianson D. 2012. Sea-air CO2 fluxes in the western Canadian coastal ocean. Prog Oceanogr, 101: 78–91
Falkowski P, Scholes R J, Boyle E, Canadell J, Canfield D, Elser J, Gruber N, Hibbard K, H?gberg P, Linder S, Mackenzie F T, Moore I I I B, Pedersen T, Rosenthal Y, Seitzinger S, Smetacek V, Steffen W. 2000. The global carbon cycle: A test of our knowledge of Earth as a system. Science, 290: 291–296
Fransson A, Chierici M, Nojiri Y. 2006. Increased net CO2 outgassing in the upwelling region of the southern Bering Sea in a period of variable marine climate between 1995 and 2001. J Geophys Res, 111: C08008 Friederich G E, Ledesma J, Ulloa O, Chavez F P. 2008. Air-sea carbon dioxide fluxes in the coastal southeastern tropical Pacific. Prog Ocea-
nogr, 79: 156–166
Friederich G E, Walz P M, Burczynski M G, Chavez F P. 2002. Inorganic carbon in the central California upwelling system during the 1997–1999 El Ni?o-La Ni?a event. Prog Oceanogr, 54: 185–203
Gagan M K, Ayliffe L K, Opdyke B N, Hopley D, Scott-Gagan H, Cowley
J. 2002. Coral oxygen isotope evidence for recent groundwater fluxes to the Australian Great Barrier Reef. Geophys Res Lett, 29: 43-1–43-4
Gan J, Li H, Curchitser E N, Haidvogel D B. 2006. Modeling South China Sea circulation: Response to seasonal forcing regimes. J Geophys Res, 111: C06034
Gao Z, Chen L, Sun H, Chen B, Cai W J. 2012. Distributions and air-sea fluxes of carbon dioxide in the Western Arctic Ocean. Deep-Sea Res Part II-Top Stud Oceanogr, 81-84: 46–52
Guo X, Cai W J, Zhai W, Dai M, Wang Y, Chen B. 2008. Seasonal variations in the inorganic carbon system in the Pearl River (Zhujiang) estuary. Cont Shelf Res, 28: 1424–1434
Guo X, Dai M, Zhai W, Cai W J, Chen B. 2009. CO2 flux and seasonal variability in a large subtropical estuarine system, the Pearl River Es- tuary, China. J Geophys Res, 114: G03013
Guo H Q, Noormets A, Zhao B, Chen J Q, Sun G, Gu Y J, Li B, Chen J K. 2009. Tidal effects on net ecosystem exchange of carbon in an estuarine wetland. Agric For Meteorol, 149: 1820–1828
Guo X H, Zhai W D, Dai M H, Zhang C, Bai Y, Xu Y, Li Q, Wang G Z. 2015. Air-sea CO2 fluxes in the East China Sea based on multiple-year underway observations. Biogeosciences, 12: 5495–5514
Guo X, Zhang Y, Zhang F, Cao Q. 2010. Characteristics and flux of settling particulate matter in neritic waters: The southern Yellow Sea and the East China Sea. Deep-Sea Res Part II-Top Stud Oceanogr, 57: 1058– 1063
Hales B, Takahashi T, Bandstra L. 2005. Atmospheric CO2 uptake by a coastal upwelling system. Glob Biogeochem Cycle, 19: GB1009
Hopkinson C S, Cai W J, Hu X. 2012. Carbon sequestration in wetland dominated coastal systems—A global sink of rapidly diminishing magnitude. Curr Opin Env Sust, 4: 186–194
Ho T Y, You C F, Chou W C, Pai S C, Wen L S, Sheu D D. 2009. Cadmium and phosphorus cycling in the water column of the South China Sea: The roles of biotic and abiotic particles. Mar Chem, 115: 125–133
Hood E M, Merlivat L, Johannessen T. 1999. Variations of ?CO2 and air- sea flux of CO2 in the Greenland Sea gyre using high-frequency time series data from CARIOCA drift buoys. J Geophys Res, 104: 20571–Hu D, Yang Z. 2001. Key Processes of Ocean Fluxes in the East China Sea (in Chinese). Beijing: Ocean Press. 205
Huang T H, Chen C T A, Tseng H C, Lou J Y, Wang S L, Yang L, Kandasamy S, Gao X, Wang J T, Aldrian E, Jacinto G S, Anshari G Z, Sompongchaiyakul P, Wang B J. 2017. Riverine carbon fluxes to the South China Sea. J Geophys Res, 122: 1239–1259
Hung C C, Tseng C W, Gong G C, Chen K S, Chen M H, Hsu S C. 2013. Fluxes of particulate organic carbon in the East China Sea in summer. Biogeosciences, 10: 6469–6484
Ito R G, Schneider B, Thomas H. 2005. Distribution of surface fCO2 and air-sea fluxes in the Southwestern subtropical Atlantic and adjacent continental shelf. J Mar Syst, 56: 227–242
Jiao N Z, Herndl G J, Hansell D A, Benner R, Kattner G, Wilhelm S W, Kirchman D L, Weinauer M G, Luo T W, Chen F, Azam F. 2010. Microbial production of recalcitrant dissolved organic matter: Long- term carbon storage in the global ocean. Nat Rev Microbiol, 8: 593–599 Kang D J, Kim J Y, Lee T, Kim K R. 2010. The East Sea (Sea of Japan). In: Liu K K, Atkinson L, Qui?ones R, Talaue-Mamanus L, eds. Carbon and Nutrient Fluxes in Continental Margins: A global Synthesis. Heidel-
berg: Springer-Verlag. 383–393
Laruelle G G, D rr H H, Slomp C P, Borges A V. 2010. Evaluation of sinks and sources of CO2 in the global coastal ocean using a spatially-explicit typology of estuaries and continental shelves. Geophys Res Lett, 37: L15607
Laruelle G G, Lauerwald R, Pfeil B, Regnier P. 2014. Regionalized global budget of the CO2 exchange at the air-water interface in continental shelf seas. Glob Biogeochem Cycle, 28: 1199–1214
Le Qu r C, Andrew R M, Friedlingstein P, Sitch S, Pongratz J, Manning A C, Korsbakken J I, Peters G P, Canadell J G, Jackson R B, Boden T A, Tans P P, Andrews O D, Arora V K, Bakker D C E, Barbero L, Becker M, Betts R A, Bopp L, Chevallier F, Chini L P, Ciais P, Cosca C E, Cross J, Currie K, Gasser T, Harris I, Hauck J, Haverd V, Houghton R A, Hunt C W, Hurtt G, Ilyina T, Jain A K, Kato E, Kautz M, Keeling R F, Klein Goldewijk K, K?rtzinger A, Landsch tzer P, Lef vre N, Lenton A, Lienert S, Lima I, Lombardozzi D, Metzl N, Millero F, Monteiro P M S, Munro D R, Nabel J E M S, Nakaoka S, Nojiri Y, Pad n X A, Peregon A, Pfeil B, Pierrot D, Poulter B, Rehder G, Reimer J, R?denbeck C, Schwinger J, S f rian R, Skjelvan I, Stocker B D, Tian H, Tilbrook B, van der Laan-Luijkx I T, van der Werf G R, van Heuven S, Viovy N, Vuichard N, Walker A P, Watson A J, Wiltshire A J, Zaehle S, Zhu D. 2017. Global carbon budget 2017. Earth Syst Sci Data, 10: 405–448
Li H, Wiesner M G, Chen J, Ling Z, Zhang J, Ran L. 2017. Long-term variation of mesopelagic biogenic flux in the central South China Sea: Impact of monsoonal seasonality and mesoscale eddy. Deep-Sea Res Part I-Oceanogr Res Pap, 126: 62–72
Li L, Qu T D. 2006. Thermohaline circulation in the deep South China Sea basin inferred from oxygen distributions. J Geophys Res, 111: C05017 Liu H, Ren H, Hui D, Wang W, Liao B, Cao Q. 2014. Carbon stocks and potential carbon storage in the mangrove forests of China. J Environ
Manage, 133: 86–93
Liu K K, Atkinson L, Qui?ones R, Talaue-Mcmanus L. 2010a. Carbon and Nutrient Fluxes in Continental Margins: A Global Synthesis. Heidel- berg: Springer. 741
Liu K K, Atkinson L, Qui?ones R, Talaue-Mcmanus L. 2010b. Bio- geochemistry of the Kuroshio and the East China Sea. In: Liu K K, Atkinson L, Qui?ones R, Talaue-Mcmanus L, eds. Carbon and Nutrient Fluxes in Continental Margins: A Global Synthesis. IGBP Book Series. Heidelberg: Springer. 3–24
Liu K K, Chao S Y, Marra J, Snidvongs A. 2006. Monsoonal forcing and biogeochemical environments of outer southeast Asia seas. In: Ro- binson A, Brink K H, eds. The Sea: Ideas and Observations on Progress in the Study of Seas, the Global Coastal Ocean: Interdisciplinary Re- gional Studies and Synthesis. Cambridge: Harvard University Press. 673–721
Liu K K, Iseki K, Chao S Y. 2000. Continental margin carbon fluxes. In:
Hanson R B, Ducklow H W, Field J G, eds. The Changing Ocean Carbon Cycle. Cambridge: Cambridge University Press. 187–239
Liu Q, Charette M A, Henderson P B, McCorkle D C, Martin W, Dai M. 2014. Effect of submarine groundwater discharge on the coastal ocean inorganic carbon cycle. Limnol Oceanogr, 59: 1529–1554
Liu Q, Dai M, Chen W, Huh C A, Wang G, Li Q, Charette M A. 2012. How significant is submarine groundwater discharge and its associated dis- solved inorganic carbon in a river-dominated shelf system? Bio- geosciences, 9: 1777–1795
Liu Z, Zhang L, Cai W J, Wang L, Xue M, Zhang X. 2014. Removal of dissolved inorganic carbon in the Yellow River Estuary. Limnol Oceanogr, 59: 413–426
Lu X, Song J, Yuan H, Li N. 2015. Carbon distribution and exchange of Kuroshio and adjacent China sea shelf: A review (in Chinese). Adv Earth Sci, 30: 214–225
Luo X, Wei H, Liu Z, Zhao L. 2015. Seasonal variability of air-sea CO2 fluxes in the Yellow and East China Seas: A case study of continental shelf sea carbon cycle model. Cont Shelf Res, 107: 69–78
Maher D T, Santos I R, Golsby-Smith L, Gleeson J, Eyre B D. 2013. Groundwater-derived dissolved inorganic and organic carbon exports from a mangrove tidal creek: The missing mangrove carbon sink? Limnol Oceanogr, 58: 475–488
McKee B A. 2003. RiOMar: The Transport, Transformation and Fate of Carbon in River-Dominated Ocean Margins. RiOMar Workshop. Tu- lane University
Moore W S. 1999. The subterranean estuary: A reaction zone of ground water and sea water. Mar Chem, 65: 111–125
Nakaoka S I, Aoki S, Nakazawa T, Hashida G, Morimoto S, Yamanouchi T, Yoshikawa-Inoue H. 2006. Temporal and spatial variations of oceanic pCO2 and air-sea CO2 flux in the Greenland Sea and the Barents Sea. Tellus Ser B-Chem Phys Meteorol, 58: 148–161
Ni H G, Lu F H, Luo X L, Tian H Y, Zeng E Y. 2008. Riverine inputs of total organic carbon and suspended particulate matter from the Pearl River Delta to the coastal ocean off South China. Mar Pollut Bull, 56: 1150–1157
Nozaki Y, Yamamoto Y. 2001. Radium 228 based nitrate fluxes in the eastern Indian Ocean and the South China Sea and a silicon-induced “alkalinity pump” hypothesis. Glob Biogeochem Cycle, 15: 555–567
Oh D C, Park M K, Kim K R. 2000. CO2 exchange at air-sea interface in the Huanghai Sea. Acta Oceanol Sin, 19: 79–89
Omar A M, Johannessen T, Olsen A, Kaltin S, Rey F. 2007. Seasonal and interannual variability of the air-sea CO2 flux in the Atlantic sector of the Barents Sea. Mar Chem, 104: 203–213
Pan Y, Birdsey R A, Fang J, Houghton R, Kauppi P E, Kurz W A, Phillips O L, Shvidenko A, Lewis S L, Canadell J G, Ciais P, Jackson R B, Pacala S W, McGuire A D, Piao S, Rautiainen A, Sitch S, Hayes D. 2011. A large and persistent carbon sink in the world’s forests. Science, 333: 988–993
Peng T H, Hung J J, Wanninkhof R, Millero F J. 1999. Carbon budget in the East China Sea in spring. Tellus Ser B-Chem Phys Meteorol, 51: 531–540
Qu B X, Song J M, Yuan H M, Li X G, Li N. 2014. Air-sea CO2 exchange process in the southern Yellow Sea in April of 2011, and June, July, October of 2012. Cont Shelf Res, 80: 8–19
Qu T, Girton J B, Whitehead J A. 2006. Deepwater overflow through Luzon strait. J Geophys Res, 111: C01002
Ran L, Lu X X, Sun H, Han J, Li R, Zhang J. 2013. Spatial and seasonal variability of organic carbon transport in the Yellow River, China. J Hydrol, 498: 76–88
Regnier P, Friedlingstein P, Ciais P, Mackenzie F T, Gruber N, Janssens I A, Laruelle G G, Lauerwald R, Luyssaert S, Andersson A J, Arndt S, Arnosti C, Borges A V, Dale A W, Gallego-Sala A, Godd ris Y, Goossens N, Hartmann J, Heinze C, Ilyina T, Joos F, LaRowe D E, Leifeld J, Meysman F J R, Munhoven G, Raymond P A, Spahni R, Suntharalingam P, Thullner M. 2013. Anthropogenic perturbation of the carbon fluxes from land to ocean. Nat Geosci, 6: 597–607
Rehder G, Suess E. 2001. Methane and pCO2 in the Kuroshio and the SouthChina Sea during maximum summer surface temperatures. Mar Chem, 75: 89–108
Sabine C L, Feely R A, Gruber N, Key R M, Lee K, Bullister J L, Wan- ninkhof R, Wong C S, Wallace D W R, Tilbrook B, Millero F J, Peng T H, Kozyr A, Ono T, Rios A F. 2004. The oceanic sink for anthropogenic CO2. Science, 305: 367–371
Sadat-Noori M, Maher D T, Santos I R. 2016. Groundwater discharge as a source of dissolved carbon and greenhouse gases in a subtropical es- tuary. Estuaries Coasts, 39: 639–656
Sanders C J, Maher D T, Tait D R, Williams D, Holloway C, Sippo J Z, Santos I R. 2016. Are global mangrove carbon stocks driven by rainfall? J Geophys Res, 121: 2600–2609
Santos I R, Burnett W C, Dittmar T, Suryaputra I G N A, Chanton J. 2009. Tidal pumping drives nutrient and dissolved organic matter dynamics in a gulf of mexico subterranean estuary. Geochim Cosmochim Acta, 73: 1325–1339
Sarmiento J L, Gruber N. 2002. Sinks for anthropogenic carbon. Phys Today, 55: 30–36
Semiletov I P, Pipko I I, Repina I, Shakhova N E. 2007. Carbonate chemistry dynamics and carbon dioxide fluxes across the atmosphere- ice-water interfaces in the Arctic Ocean: Pacific sector of the Arctic. J Mar Syst, 66: 204–226
Sheu D D, Chou W C, Chen C T A, Wei C L, Hsieh H L, Hou W P, Dai M. 2009. Riding over the Kuroshio from the South to the East China Sea: Mixing and transport of DIC. Geophys Res Lett, 36: L07603
Sheu D D, Chou W C, Wei C L, Hou W P, Wong G T F, Hsu C W. 2010. Influence of El Ni?o on the sea-to-air CO2 flux at the SEATS time- series site, northern South China Sea. J Geophys Res, 115: C10021
Shim J H, Kim D, Kang Y C, Lee J H, Jang S T, Kim C H. 2007. Seasonal variations in pCO2 and its controlling factors in surface seawater of the northern East China Sea. Cont Shelf Res, 27: 2623–2636
Sippo J Z, Maher D T, Tait D R, Ruiz-Halpern S, Sanders C J, Santos I R. 2017. Mangrove outwelling is a significant source of oceanic ex- changeable organic carbon. Limnol Oceanogr, 2: 1–8
Skjelvan I, Johannessen T, Miller L A. 1999. Interannual variability of fCO2 in the Greenland and Norwegian Seas. Tellus Ser B-Chem Phys Meteorol, 51: 477–489
Slagstad D, Downing K, Carlotti F, Hirche H J. 1999. Modelling the carbon export and air-sea flux of CO2 in the Greenland Sea. Deep-Sea Res Part II-Top Stud Oceanogr, 46: 1511–1530
S?vik A K, Kl?ve B. 2007. Emission of N2O and CH4 from a constructed wetland in southeastern Norway. Sci Total Environ, 380: 28–37
Sutula M A, Perez B C, Reyes E, Childers D L, Davis S, Day Jr. J W, Rudnick D, Sklar F. 2003. Factors affecting spatial and temporal variability in material exchange between the Southern Everglades wetlands and Florida Bay (USA). Estuar Coast Shelf Sci, 57: 757–781 State Oceanic Administration. 2013. China’s Marine Environment Bulletin
in 2012 (in Chinese). 75–77
Takahashi T, Sutherland S C, Wanninkhof R, Sweeney C, Feely R A, Chipman D W, Hales B, Friederich G, Chavez F, Sabine C, Watson A, Bakker D C E, Schuster U, Metzl N, Yoshikawa-Inoue H, Ishii M, Midorikawa T, Nojiri Y, K?rtzinger A, Steinhoff T, Hoppema M, Olafsson J, Arnarson T S, Tilbrook B, Johannessen T, Olsen A, Bel- lerby R, Wong C S, Delille B, Bates N R, de Baar H J W. 2009. Climatological mean and decadal change in surface ocean pCO2, and net sea-air CO2 flux over the global oceans. Deep-Sea Res Part II-Top Stud Oceanogr, 56: 554–577
Thomas H, Schneider B. 1999. The seasonal cycle of carbon dioxide in Baltic Sea surface waters. J Mar Syst, 22: 53–67
Thomas H, Bozec Y, de Baar H J W, Elkalay K, Frankignoulle M, Schiettecatte L S, Kattner G, Borges A V. 2005. The carbon budget of the North Sea. Biogeosciences, 2: 87–96
Thomas H, Bozec Y, Elkalay K, de Baar H J W. 2004. Enhanced open ocean storage of CO2 from shelf sea pumping. Science, 304: 1005–1008 Tian J W, Yang Q X, Liang X F, Xie L L, Hu D X, Wang F, Qu T D. 2006.
Observation of Luzon Strait transport. Geophys Res Lett, 33: L19607 Torres R, Turner D R, Rutllant J, Lef vre N. 2003. Continued CO2 out-gassing in an upwelling area off northern Chile during the development phase of El Ni?o 1997–1998 (July 1997). J Geophys Res, 108: 3336
Torres R, Pantoja S, Harada N, Gonz lez H E, Daneri G, Frangopulos M, Rutllant J A, Duarte C M, R iz-Halpern S, Mayol E, Fukasawa M. 2011. Air-sea CO2 fluxes along the coast of Chile: From CO2 outgassing in central northern upwelling waters to CO2 uptake in southern Pata- gonian fjords. J Geophys Res, 116: C09006
Tseng C M, Liu K K, Gong G C, Shen P Y, Cai W J. 2011. CO2 uptake in the East China Sea relying on Changjiang runoff is prone to change. Geophys Res Lett, 38: L24609
Tseng C M, Shen P Y, Liu K K. 2014. Synthesis of observed air-sea CO2 exchange fluxes in the river-dominated East China Sea and improved estimates of annual and seasonal net mean fluxes. Biogeosciences, 11: 3855–3870
Tseng C M, Wong G T F, Chou W C, Lee B S, Sheu D D, Liu K K. 2007. Temporal variations in the carbonate system in the upper layer at the SEATS station. Deep-Sea Res Part II-Top Stud Oceanogr, 54: 1448– 1468
Tsunogai S, Watanabe S, Sato T. 1999. Is there a “continental shelf pump” for the absorption of atmospheric CO2? Tellus Ser B-Chem Phys Me- teorol, 51: 701–712
Vandemark D, Salisbury J E, Hunt C W, Shellito S M, Irish J D, McGillis W R, Sabine C L, Maenner S M. 2011. Temporal and spatial dynamics of CO2 air-sea flux in the Gulf of Maine. J Geophys Res, 116: C01012
Wang G, Dai M, Shen S S P, Bai Y, Xu Y. 2014. Quantifying uncertainty sources in the gridded data of sea surface CO2 partial pressure. J Geophys Res, 119: 5181–5189
Wang H, Dai M, Liu J, Kao S J, Zhang C, Cai W J, Wang G, Qian W, Zhao M, Sun Z. 2016. Eutrophication-driven hypoxia in the East China Sea off the Changjiang Estuary. Environ Sci Technol, 50: 2255–2263
Wang G, Wang Z, Zhai W, Moore W S, Li Q, Yan X, Qi D, Jiang Y. 2015. Net subterranean estuarine export fluxes of dissolved inorganic C, N, P, Si, and total alkalinity into the Jiulong River estuary, China. Geochim Cosmochim Acta, 149: 103–114
Wang S L, Arthur Chen C T, Hong G H, Chung C S. 2000. Carbon dioxide and related parameters in the East China Sea. Cont Shelf Res, 20: 525– 544
Wang X, Ma H, Li R, Song Z, Wu J. 2012. Seasonal fluxes and source variation of organic carbon transported by two major Chinese Rivers: The Yellow River and Changjiang (Yangtze) River. Glob Biogeochem Cycle, 26: GB2025
Wei C L, Lin S Y, Sheu D D D, Chou W C, Yi M C, Santschi P H, Wen L
S. 2011. Particle-reactive radionuclides (234Th, 210Pb, 210Po) as tracers for the estimation of export production in the South China Sea. Bio- geosciences, 8: 3793–3808
Wu K, Dai M, Chen J, Meng F, Li X, Liu Z, Du C, Gan J. 2015. Dissolved organic carbon in the South China Sea and its exchange with the Western Pacific Ocean. Deep-Sea Res Part II-Top Stud Oceanogr, 122: 41–51
Wu Y, Zhang J, Liu S M, Zhang Z F, Yao Q Z, Hong G H, Cooper L. 2007. Sources and distribution of carbon within the Yangtze River system. Estuar Coast Shelf Sci, 71: 13–25
Xia B, Zhang L. 2011. Carbon distribution and fluxes of 16 rivers dis- charging into the Bohai Sea in summer. Acta Oceanol Sin, 30: 43–54
Xu X, Zang K, Zhao H, Zheng N, Huo C, Wang J. 2016. Monthly CO2 at A4HDYD station in a productive shallow marginal sea (Yellow Sea) with a seasonal thermocline: Controlling processes. J Mar Syst, 159: 89–99
Xue L, Xue M, Zhang L, Sun T, Guo Z, Wang J. 2012. Surface partial pressure of CO2 and air-sea exchange in the northern Yellow Sea. J Mar Syst, 105-108: 194–206
Xue L, Zhang L, Cai W J, Jiang L Q. 2011. Air-sea CO2 fluxes in the southern Yellow Sea: An examination of the continental shelf pump hypothesis. Cont Shelf Res, 31: 1904–1914
Yang W F, Huang Y P, Chen M, Qiu Y S, Peng A G, Zhang L. 2009. Export and remineralization of POM in the Southern Ocean and the South China Sea estimated from 210Po/210Pb disequilibria. Chin SciBull, 54: 2118–2123
Yin W, Qi Y, Cao Z, Zhang Y, Tang H. 2012. The environmental char- acteristics of the major Greenhouse gases and seawater pCO2 in the Bohai Sea (in Chinese). Trans Oceanol Limnol, 4: 189–193
Zhai W D, Dai M. 2009. On the seasonal variation of air-sea CO2 fluxes in the outer Changjiang (Yangtze River) Estuary, East China Sea. Mar Chem, 117: 2–10
Zhai W D, Dai M, Cai W J. 2009. Coupling of surface pCO2 and dissolved oxygen in the northern South China Sea: impacts of contrasting coastal processes. Biogeosciences, 6: 2589–2598
Zhai W D, Dai M, Cai W J, Wang Y, Hong H. 2005. The partial pressure of carbon dioxide and air-sea fluxes in the northern South China Sea in spring, summer and autumn. Mar Chem, 96: 87–97
Zhai W D, Dai M H, Chen B S, Guo X H, Li Q, Shang S L, Zhang C Y, Cai W J, Wang D X. 2013. Seasonal variations of sea-air CO2 fluxes in the largest tropical marginal sea (South China Sea) based on multiple-year underway measurements. Biogeosciences, 10: 7775–7791
Zhai W D, Dai M, Guo X H. 2007. Carbonate system and CO2 degassing fluxes in the inner estuary of Changjiang (Yangtze) River, China. Mar
Chem, 107: 342–356
Zhai W D, Yan X L, Qi D. 2017. Biogeochemical generation of dissolved inorganic carbon and nitrogen in the North Branch of inner Changjiang Estuary in a dry season. Estuar Coast Shelf Sci, 197: 136–149
Zhang F, Liu A, Li Y, Zhao L, Wang Q, Du M. 2008. CO2 flux in alpine wetland ecosystem on the Qinghai-Tibetan Plateau, China. Acta Ecol Sin, 28: 453–462
Zhang X, Zhang L. 2007. Phenomena of pH instant increasing and its effect on dissolved inorganic carbon flux to sea in Yellow River estuary (in Chinese). Environ Sci, 28: 1216–1222
Zhang Y, Zhang F, Guo X, Zhang M. 2004. Vertical flux of the settling particulate matter in the water column of the Yellow Sea in Summer (in Chinese). Oceanol Limnol Sin, 35: 230–238
Zhang Y, Zhang F, Guo X, Zhang M. 2005. Autumn vertical flux of settling particulate matter at three typical stations in the Yellow Sea (in Chi- nese). Geochimica, 34: 123–128
Zhou K. 2009. Preliminary research on the distribution, export and dy- namics of particulate organic carbon in spring in Yellow Sea. Master Thesis (in Chinese). Xiamen: Xiamen University
(Responsible editor: Chuanlun ZHANG)