

Carbon pools and fluxes in the China Seas and adjacent oceans
Nianzhi JIAO1*, Yantao LIANG1,2, Yongyu ZHANG2, Jihua LIU3, Yao ZHANG1, Rui ZHANG1, Meixun ZHAO4, Minhan DAI1, Weidong ZHAI3, Kunshan GAO1, Jinming SONG5, Dongliang YUAN5, Chao LI6, Guanghui LIN7, Xiaoping HUANG8,
Hongqiang YAN8, Limin HU9, Zenghu ZHANG2, Long WANG2, Chunjie CAO2, Yawei LUO1, Tingwei LUO1, Nannan WANG1, Hongyue DANG1, Dongxiao WANG8 & Si ZHANG8
1 State Key Laboratory of Marine Environmental Science, Xiamen University, Xiamen 361101, China;
2 Key Laboratory of Biofuels, Shandong Provincial Key Laboratory of Energy Genetics, Qingdao Institute of Bioenergy and
Bioprocess Technology, Chinese Academy of Sciences, Qingdao 266101, China;
3 Institute of Marine Science and Technology, Shandong University, Qingdao 266273, China;
4 Key Laboratory of Marine Chemistry Theory and Technology (Ocean University of China), Ministry of Education/Qingdao
Collaborative Innovation Center of Marine Science and Technology, Qingdao 266100, China;
5 Institute of Oceanology, Chinese Academy of Sciences, Qingdao 266071, China;
6 State Key Laboratory of Biogeology and Environmental Geology, China University of Geosciences, Wuhan 430074, China;
7 Ministry of Education Key Laboratory for Earth System Modeling, Department of Earth System Science,
Tsinghua University, Beijing 100084, China;
8 South China Sea Institute of Oceanology, Chinese Academy of Sciences, Guangzhou 510301, China;
9 Key Laboratory of Marine Sedimentology and Environmental Geology, First Institute of Oceanography, State Oceanic Administration, Qingdao 266061, China
Received January 14, 2018; revised May 14, 2018; accepted August 16, 2018; published online September 29, 2018
Abstract
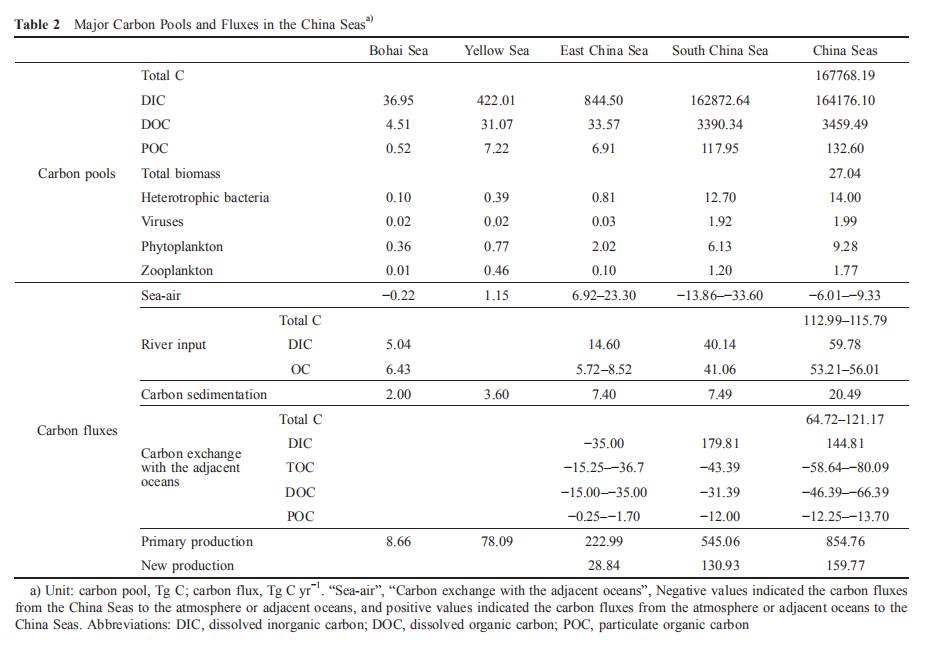
The China Seas include the South China Sea, East China Sea, Yellow Sea, and Bohai Sea. Located off the Northwestern Pacific margin, covering 4700000 km2 from tropical to northern temperate zones, and including a variety of continental margins/basins and depths, the China Seas provide typical cases for carbon budget studies. The South China Sea being a deep basin and part of the Western Pacific Warm Pool is characterized by oceanic features; the East China Sea with a wide continental shelf, enormous terrestrial discharges and open margins to the West Pacific, is featured by strong cross-shelf materials transport; the Yellow Sea is featured by the confluence of cold and warm waters; and the Bohai Sea is a shallow semi- closed gulf with strong impacts of human activities. Three large rivers, the Yangtze River, Yellow River, and Pearl River, flow into the East China Sea, the Bohai Sea, and the South China Sea, respectively. The Kuroshio Current at the outer margin of the Chinese continental shelf is one of the two major western boundary currents of the world oceans and its strength and position directly affect the regional climate of China. These characteristics make the China Seas a typical case of marginal seas to study carbon storage and fluxes. This paper systematically analyzes the literature data on the carbon pools and fluxes of the Bohai Sea, Yellow Sea, East China Sea, and South China Sea, including different interfaces (land-sea, sea-air, sediment-water, and marginal sea-open ocean) and different ecosystems (mangroves, wetland, seagrass beds, macroalgae mariculture, coral reefs, euphotic zones, and water column). Among the four seas, the Bohai Sea and South China Sea are acting as CO2 sources, releasing about0.22 and 13.86–33.60 Tg C yr-1 into the atmosphere, respectively, whereas the Yellow Sea and East China Sea are acting as carbon sinks, absorbing about 1.15 and 6.92–23.30 Tg C yr-1 of atmospheric CO2, respectively. Overall, if only the CO2 exchange at the sea-air interface is considered, the Chinese marginal seas appear to be a source of atmospheric CO2, with a net release of 6.01–9.33 Tg C yr-1, mainly from the inputs of rivers and adjacent oceans. The riverine dissolved inorganic carbon (DIC) input into the Bohai Sea and Yellow Sea, East China Sea, and South China Sea are 5.04, 14.60, and 40.14 Tg C yr-1, respectively. The DIC input from adjacent oceans is as high as 144.81 Tg C yr-1, significantly exceeding the carbon released from the seas to the atmosphere. In terms of output, the depositional fluxes of organic carbon in the Bohai Sea, Yellow Sea, East China Sea, and South China Sea are 2.00, 3.60, 7.40, and 5.92 Tg C yr-1, respectively. The fluxes of organic carbon from the East China Sea and South China Sea to the adjacent oceans are 15.25–36.70 and 43.93 Tg C yr-1, respectively. The annual carbon storage of mangroves, wetlands, and seagrass in Chinese coastal waters is 0.36–1.75 Tg C yr-1, with a dissolved organic carbon (DOC) output from seagrass beds of up to 0.59 Tg C yr-1. Removable organic carbon flux by Chinese macroalgae mariculture account for 0.68 Tg C yr-1 and the associated POC depositional and DOC releasing fluxes are 0.14 and 0.82 Tg C yr-1, re- spectively. Thus, in total, the annual output of organic carbon, which is mainly DOC, in the China Seas is 81.72–104.56 Tg C yr-1. The DOC efflux from the East China Sea to the adjacent oceans is 15.00–35.00 Tg C yr-1. The DOC efflux from the South China Sea is 31.39 Tg C yr-1. Although the marginal China Seas seem to be a source of atmospheric CO2 based on the CO2 flux at the sea-air interface, the combined effects of the riverine input in the area, oceanic input, depositional export, and microbial carbon pump (DOC conversion and output) indicate that the China Seas represent an important carbon storage area.
Keywords China Seas, “Source” or “sink” of CO2, Carbon pool, Carbon flux, Biological pump, Microbial carbon pump
Citation: Jiao N, Liang Y, Zhang Y, Liu J, Zhang Y, Zhang R, Zhao M, Dai M, Zhai W, Gao K, Song J, Yuan D, Li C, Lin G, Huang X, Yan H, Hu L, Zhang Z, Wang L, Cao C, Luo Y, Luo T, Wang N, Dang H, Wang D, Zhang S. 2018. Carbon pools and fluxes in the China Seas and adjacent oceans. Science China Earth Sciences, 61: 1535–1563, https://doi.org/10.1007/s11430-018-9190-x
1.Introduction
The size of the ocean carbon reservoir is approximately 50 times that of the atmospheric carbon pool and 20 times that of the terrestrial carbon pool (Holm n, 2000). Approxi- mately 48% of the CO2 released by human activities has been absorbed by the ocean since the industrial revolution (Sabine et al., 2004; DeVries, 2014). The ocean is therefore a huge “buffer” of global climate change (DeVries et al., 2017; Le Qu r et al., 2018). Long-term carbon sequestration in the ocean is mainly driven by carbon fixation and transformation by marine organisms, which is known as “biological carbon sink” or “blue carbon sink”. The “Blue Carbon” report, jointly released by the United Nations Environment Pro- gramme (UNEP); Food and Agricultural Organization (FAO); United Nations Educational, Scientific and Cultural Organization (UNESCO); and Intergovernmental Oceano- graphic Commission, points out that 55% of the carbon captured by global photosynthesis is blue carbon (Nellemann and Corcoran, 2009).
Carbon exchange between the sea and air interface is an important process of the ocean carbon cycle and is con- sidered to be the direct embodiment of the sink or source of a specific area. However, terrestrial inputs, sedimentation, and exchange of adjacent oceans greatly impact the carbon cycle in the marginal seas. These processes regulate the migration and exchange of inorganic and organic carbon in different carbon pools such as the atmosphere, water, sediment, and adjacent oceans. The major carbon species involved in these processes include dissolved inorganic carbon (DIC), dis- solved organic carbon (DOC), particulate organic carbon (POC), and biomass.
The mechanisms of the marine carbon sink mainly include the solubility pump (SP), carbonate pump, biological pump (BP), and microbial carbon pump (MCP) (Legendre et al., 2015). The solubility pump is mainly controlled by the ocean circulation and plays a major role in high-latitude oceans such as the North Atlantic, Antarctic and Southern oceans. During carbonate deposition processes, the carbonate pump, also called “carbonate counter pump,” releases an equivalent of CO2 (Volk and Hoffert, 1985). Both BP and MCP are driven by biological activities, which are closely related but based on distinctly different biogeochemical mechanisms (Longhurst and Harrison, 1989; Jiao et al., 2010, 2018a, 2018b). The BP depends on the sedimentation of particulate organic carbon from the surface to the deep sea and its flux sharply decreases with increasing depth. Approximately 5– 15% of the organic carbon produced by photosynthesis is transported down out of the euphotic zone (Giering et al., 2014), only 0.1% to 1% of the carbon fixed at surface is transported to the seabed (Legendre et al., 2015; Zhang et al., 2018), and only the POC buried in the sediment can be stored for long term sequestration. The mechanism of the MCP differs from that of the BP. The MCP does not rely on se- dimentation and is not related to the water depth. The MCP transforms labile organic carbon to recalcitrant DOC (RDOC), which can be stored in seawater for a long time (Jiao et al., 2010, 2018a, 2018b; Stone, 2010). The resident time of RDOC in the current ocean is 4000–6000 years (Bauer et al., 1992; Hansell et al., 2009, 2012). On the global scale, the carbon sequestration efficiency of the MCP and BP is in the same order of magnitude (Legendre et al., 2015; Polimene et al., 2016; Chen et al., 2018). However, it has been predicted that the relative contribution of the MCP to marine carbon sequestration will be enhanced with increas- ing temperature and stratification in future oceans (Jiao et al.,2014a; Polimene et al., 2016; Robinson et al., 2018). In- creasing the efficiency of the BP and MCP through human intervention or regulation provide options to increase marine carbon sequestration (Longhurst and Harrison, 1989; Jiao et al., 2010, 2011, 2018a, 2018b; Robinson et al., 2018; Poli- mene et al., 2018).
Although marginal seas account for less than 8% of the world’s oceans, the deposited organic carbon accounts for more than 80% of the total amount of marine-deposited or- ganic carbon in the world (Berner, 1982; Hedges and Keil, 1995; Burdige, 2005; Coppola et al., 2018; Keil, 2017). In addition, due to terrigenous runoff input from rivers, the marginal seas are characterized by complex biogeochemical processes and high primary productivity and play an im- portant role in linking important carbon pools such as land, ocean, and atmosphere (Battle et al., 2000; Galy et al., 2007; McKee et al., 2004). The continental shelf sea has become an important area for modern deposition due to the high de- positional rate of terrestrial input material. The continental shelf marginal sea is not only a gathering and retaining area for fine-grained sediments but also an important “sink” for sedimentary organic matter (Liu J P et al., 2004, 2007; Li J et al., 2012; Hu et al., 2013; Tao et al., 2016, 2018; Qiao S et al., 2017; Coppola et al., 2018), and thus plays an important role in the global carbon cycle and climate change regulation.
The China Seas include several marginal seas with dis- tinctive features. The South China Sea links “the third pole of the world” (Qinghai Tibet Plateau) to “the engine of global climate” (West Pacific warm pool), receiving not only land input from the plateau but also oligotrophic warm water from the ocean. The South China Sea includes a large shelf sea in the north and a nearly 4000 m deep basin, with more than 200 coral islands. In addition, strong tropical storms and various mesoscale eddies occurs in the South China Sea. The East China Sea has the widest continental shelf in the tem- perate zone, carries out enormous cross-shelf materials transport, as far as to the outer margin, the Okinawa Trough whose outside connected to the world deepest Mariana Trench. The Yellow Sea has a typical temperate continental shelf sea with notable seasonal and complex hydrological dynamics, including strong cold eddies. The Bohai sea is a semi-closed shallow gulf affected by intensive human ac- tivities from surrounding coasts. Around the China seas, there are 18000 km of coastlines, more than 1500 rivers, and nearly 7 million hectares of coastal wetlands. Strong sea– land interactions are one of the most important traits of China Seas. Three large rivers, the Yangtze River, Yellow River, and Pearl River, flow into the East China Sea, Bohai Sea, and South China Sea respectively, with corresponding flow rates of 9.65 1011, 5.6 1010, and 3.36 1011 m3 yr?1. This re-
presents an important source of carbon transport from land toocean. Kuroshio Current at the outer margin of the China Seas is one of the two major western boundary currents in theworld. Its activities directly affect the regional climate changes of a vast area of China (Wang S et al., 2015). The China Seas cover multiple climatic zones with high biodi- versity and huge carbon storage capacity. For example,~13 Tg C yr?1 of organic matter is buried in China Sea se- diments (Hu et al., 2016), accounting for about 10% of that of the global marginal seas (about 138 Tg C yr?1), and of significance of global carbon cycle (Zhang Y et al., 2017).
In this paper, we performed a systematic analysis of the carbon pools of the South China Sea, East China Sea, Yellow Sea, and Bohai Sea, as well as relevant carbon fluxes be- tween sea-air, water-sediment, land-sea, and sea-ocean. Contributions by typical coastal ecosystems, such as man- groves, wetlands, seagrass beds, coral reefs, and macroalgae mariculture are also analyzed. Despite the great efforts col- lecting data, it is hard to align multiple sources for a single conclusive result regarding specific research needs, the au- thors put together data in order to provide a comprehensive basis for studies on climate changes and the development of marine carbon sequestration.
2.Data sources and processing
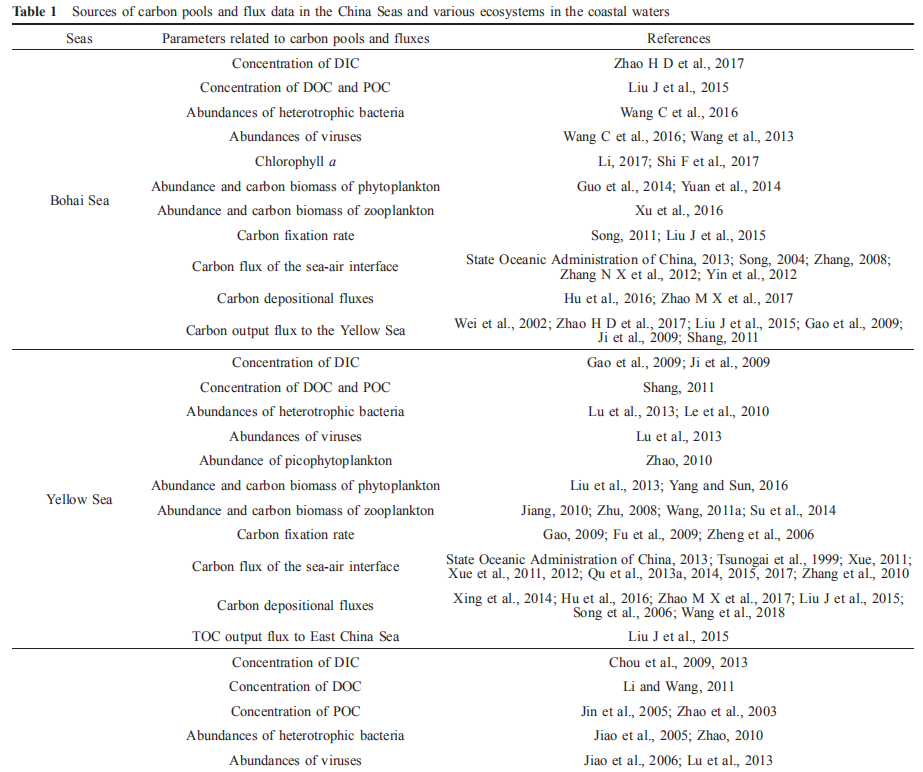
2.1Data sources of carbon pools and fluxes in the China Seas
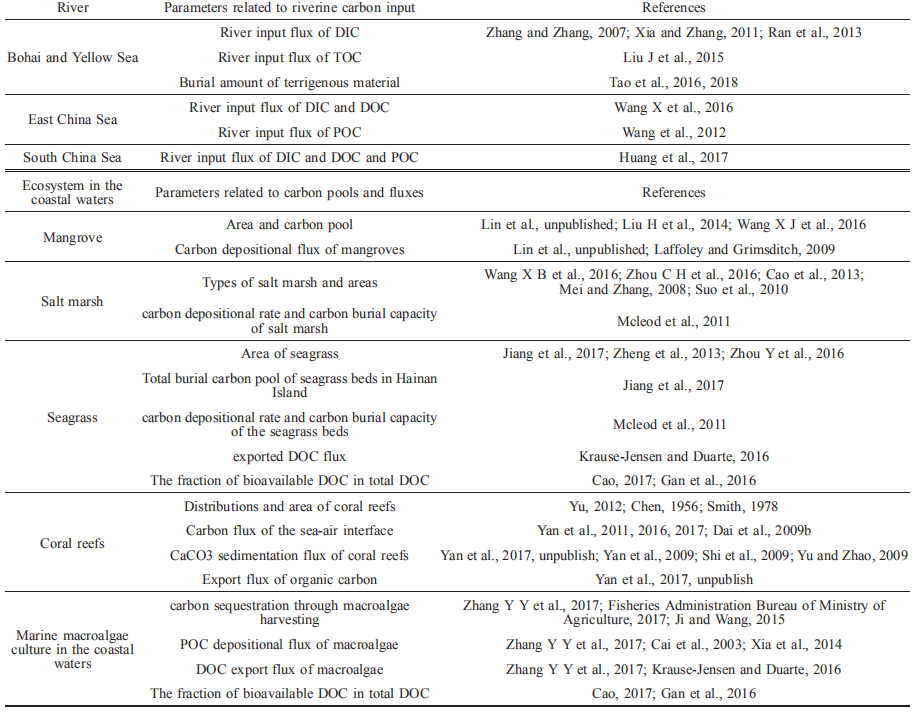
The carbon inventories in the Bohai sea, Yellow Sea, East China Sea, and South China Sea include DIC, DOC, POC, biological carbon pool (bacteria, viruses, phytoplankton, and zooplankton), and other types of carbon pools. The carbon fluxes in the Bohai Sea, Yellow Sea, East China Sea, and South China Sea include the air-sea flux, river inputs, POC vertical outputs, seafloor depositional flux, and exchange flux with the adjacent oceans. In addition, they include the burial carbon flux from mangroves, wetland salt marshes and seagrass beds; air-sea flux and calcium deposition in coral reefs; and removable organic carbon flux, sediment organic carbon flux, and releasing organic carbon flux of macroalgae mariculture in offshore areas.
During data collection, the same parameter was measuredfor different cases using the same or similar methods. In some cases, several methods were used if the methods were all approved; for example, the POC export flux from the euphotic zone can be measured using the isotopic dis- equilibrium or sediment trap. Therefore, the data from dif- ferent sampling methods were labeled.
2.2Determination of parameters related to the carbon pools and fluxes in the China Seas
The methods used to measure multiple parameters related to the carbon pools and fluxes in our study were as follows: the DIC concentration was measured using a nondispersive in-frared detector (Chou et al., 2005, 2007b; Cao et al., 2011); the DOC concentration was determined with a high-tem- perature combustion method employing a total organic car- bon (TOC) analyzer (Dai et al., 2009a; Shang, 2011); the POC samples were filtered through a high-temperature pre- treated GF/F filter and preserved by HCl fumigation to re- move inorganic carbon and the POC concentration was determined with an elemental analyzer (Shang, 2011); the abundances of heterotrophic bacteria, viruses, and picophy- toplankton were obtained from flow cytometry (Jiao et al., 2002, 2005, 2006); chlorophyll a was determined fluor- ometrically with an acetone extraction method (Chen et al., 2012; Ning et al., 2004); the abundance and biomass of phytoplankton were determined with an inverted microscope based on different particle sizes and shapes (Sun and Liu, 2003); the carbon fixation rate was measured with a liquid scintillation detector, where the 14C samples were labeled and dark-incubated (Jiao et al., 1998); and the abundance of zooplankton after collection by trawling was determined based on microscopic examination and the biomass using the wet and dry weight method (Zhu, 2008; Jiang, 2010). The CO2 exchanges at the sea-air interface was obtained using a water balance method of pCO2, carbonate system calculation of pCO2, and numerical simulation method (Chai et al., 2009; Qu et al., 2013b; Zhai et al., 2013). The vertical POC export flux was obtained with isotopic disequilibrium and sediment trap methods (Chen et al., 1998; Cai et al., 2002, 2015). Sediment carbon flux was determined with a sediment trap or a method combining sediment quality, depositional rate, and sediment element analysis (Chen et al., 1998; Hu and Zhao, unpublished). The carbon exchange between the China Seas and the adjacent oceans was calculated by using the seawater flux and the difference of the carbon con- centration of the seawater (Deng et al., 2006; Chen et al., 2006; Wu et al., 2015).
2.3Estimation of the carbon pools and fluxes in the China Seas and preliminary assessment based on the mass conservation
The carbon pools and fluxes were calculated the eqs. (1) and
(2) in case sufficient scientific reports were not available. The DIC, DOC, POC pools and biological carbon pools in the Bohai Sea, Yellow Sea, East China Sea and South China Sea were calculated based on the following eq. (1).
Carbon pool=concentration corresponding sea area corresponding water depth. (1)
The concentration of the carbon biomass of plankton in eq.
(1)corresponds to the product of the seasonal mean cell abundance and cellular carbon content using a published carbon conversion factor (CCF). The CCFs for bacteria and viruses are 20.00 fg C cell?1 (Lee and Fuhrman, 1987) and0.20 fg C virus?1 (Suttle, 2005), respectively. The carbon concentration of phytoplankton was calculated based on the chlorophyll concentration according to the reported average chlorophyll to carbon ratio (0.02) (Arteaga et al., 2016). The carbon concentration of zooplankton was calculated from an equation including dry-weight biomass and carbon content reported by Wiebe et al. (1975).
The vertical POC export fluxes at different water layers were calculated using the following equation:
Vertical POC export flux= (2) vertical POC export rate corresponding interface area.
After obtaining the parameters related to the carbon re- servoir and fluxes in the Bohai Sea, Yellow Sea, East China, Sea and South China Sea, the inorganic and organic carbon pools and biological carbon pools were calculated. Based on the combination of the sea-air flux, riverine input, sediment organic carbon flux, and exchange with the adjacent oceans, the reliability and accuracy of the data were evaluated based on mass conservation.
3.Results and discussions
3.1Carbon pools and fluxes in the Bohai Sea
3.1.1Seawater carbon pools in the Bohai Sea
The Bohai Sea is a typical semi-closed shallow gulf with an average depth of 18 m. The vertical distribution of DIC, DOC, and POC pool is relatively uniform. Even in summer, there is no significant difference in the carbon pools between the surface and bottom water. The DIC, DOC, and POC concentrations of surface water are 25.21–27.00 mg L-1 (2100.47–2250.16 mol L-1), 1.36–4.02 mg L-1 (113.33–335.00 mol L-1), and 0.22–0.96 mg L-1 (18.33–80.00 mol L-1), respectively. Their concentrations of bottom water are 26.54–34.07 mg L-1 (2211.67–2839.17 mol L-1), 1.04–3.89 mg L-1 (86.67–324.17 mol L-1), and 0.21–1.57mg L-1 (17.50–130.83 mol L-1), respectively. The bottom POC concentration in most areas of the Bohai Sea is higher than that of the surface water, which may be due to the resuspension of sediments enriched with organic matter. Similarly, the POC concentration in most areas of the Bohai Sea is relatively homogeneous, and is ~0.40 mg L-1 (33.33 mol L-1) (Zhang, 2008; Zhao H D et al., 2017). The POC, DOC, and DIC pools in Bohai water are 0.52 (0.46– 0.58), 4.51 (3.55–5.45) Tg C (Figure 1; Liu J et al., 2015),and 36.95 (34.92–37.42) Tg C (Figure 1; Zhao H D et al., 2017), respectively.
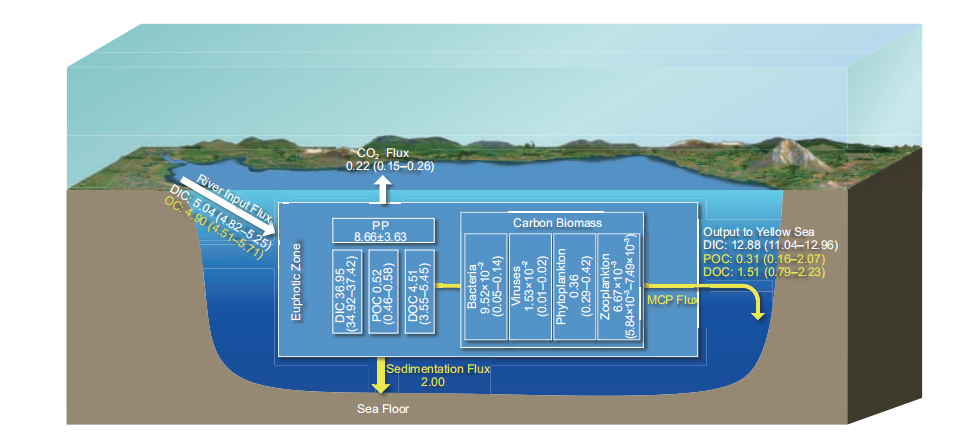
Figure 1 Main carbon pools and fluxes in the Bohai Sea. The white box represents the carbon pool (Tg C); the white arrow represents the DIC fluxes (Tg C yr?1); and the yellow arrow represents the organic carbon flux (Tg C yr-1); see Table 1 for data sources.
The seasonal variation of the biological carbon pools in the Bohai Sea is significant. The average heterotrophic bacteria abundance in summer and winter in the Bohai Sea are 5.05 106 and 1.84 106 cells mL-1, respectively. The average viral abundance in summer and winter in the Bohai Sea are7.47 107 and 3.61 107 mL-1(Wang C et al., 2016), respec- tively. The range of the viral abundance in spring, summer, autumn, and winter in the Bohai Sea are 6.40 105–9.43 106, 1.28 106–3.59 107, 1.30 106–1.02 107, and 3.54 106–8.97 106 mL-1, respectively (Wang et al., 2013). The chlorophyll a concentration in the Bohai Sea has a notable seasonal variation (Shi F et al., 2017), with the highest monthly average concentration 6.11 mg m-3 in August and the lowest concentration 4.19 mg m-3 in November (Li, 2017). In autumn of 2011 and 2012, the phytoplankton abundance in the Bohai Sea were 0.89 103–16.4 103 and 0.30 103–10.48 103 cells L-1, respectively (Chen et al., 2016; Guo et al., 2014; Yuan et al., 2014). The picoeukar- yotic abundance in the Bohai Sea in spring, summer, autumn, and winter are 1.1 103 1.3 103, 4.8 103 6.8 103, 3.1 103 2.4 103, and 5.7 103 4.8 103 cells mL-1, respectively. The Synechococcus abundance in spring, summer, autumn, and winter are 1.5 103 1.0 103, 22.0 103 20.0 103, 14.0 103 10.0 103, and 23.0 103 13.0 103 cells mL-1, respec- tively (Liang et al., 2017). The average zooplankton abun- dance in the Bohai Sea in spring, summer, autumn, and winter are 782.0, 199.6, 42.1, and 72.1 ind m-3, respectively, and theaverage wet biomass are 157.1, 135.8, 122.5, and151.1 mg m-3, respectively (Xu et al., 2016). Based on the heterotrophic bacterial, viral abundances (Wang C et al., 2016) and eq. (1), the heterotrophic bacterial and viral carbon pools are about 9.52 10-2 (0.05–0.14) Tg C and 1.53 10-2 (0.01– 0.02) Tg C, respectively. The phytoplankton and zooplankton carbon pools are 0.36 (0.29–0.42) Tg C and 6.67 10-3 (5.84 10?3–7.49 10-3) Tg C (Figure 1), respectively.
3.1.2Carbon fixation flux in the Bohai Sea
The phytoplankton carbon fixation rates (equal to primaryproductivity, PP) are significantly different in the different seasons in the Bohai Sea with order of summer spring au- tumn winter (3.60 104, 2.38 104, 2.35 104, and 1.16 104 T D-1, respectively). The total carbon fixation rate in the Bohai Sea is 8.66 3.63 Tg C yr-1 (Song, 2011; Liu J et al., 2015). The respiration organic carbon consumption rate in the Bohai Sea is 6.65 2.79 Tg C yr-1 (Figure 1; Liu J et al., 2015). The net carbon fixation flux in Bohai Sea is about~2 Tg C yr-1.
3.1.3Carbon flux cross the sea–air interface of the Bohai Sea
Due to the lack of available data of CO2 flux at the sea-air interface of Bohai Sea and the complexity and variable controlling factors in the enclosed sea, there are arguments about the CO2 sources or sinks between different reports. However, it is certain that the seasonal and regional differ- ences of carbon flux at the sea-air interface in the Bohai Sea are more significant than the other Chinese marginal seas (Song, 2004; Zhang, 2008; Zhang N X et al., 2012; Yin et al., 2012). In Bohai Sea, spring and winter represent sinks of CO2, with absorption rates of 16.90 and 3.40 kg km-2 d-1, respectively, and autumn represents the CO2 source, with a release rate of 51.10 kg km-2 d-1, while the basic budget in summer is balanced (State Oceanic Administration of China, 2013). Based on the available data (State Oceanic Admin- istration of China, 2013), the CO2 released from the Bohai Sea is 0.22 0.85 Tg C yr-1 (Figure 1).
The above-mentioned conclusions about the net carbon fixation and the CO2 released from the Bohai Sea seem to be paradoxical, but actually they contain different connotation. Firstly, carbon fixation does not equal carbon storage (Jiao et al., 2013). Secondly, open sea areas have an imbalance of spectively (Zhao, 2010). The phytoplankton abundances in the euphotic zone of the North Yellow Sea in spring, sum- mer, autumn, and winter are 9.7 104, 25.5 104, 29.4 104, and 2105.1 104 cells m-3, respectively, with an annual average of 542.4 (0.3–18103.5) 104 cells m-3 (Liu et al., 2013). The highest phytoplankton carbon concentration in the South Yellow Sea was observed in summer (4.62 11.79 104 g C m-3), while the lowest value was in autumn (<1000 g C m-3; Yang and Sun, 2016). The average zoo- plankton carbon concentrations in spring, summer, autumn, and winter in the North Yellow Sea are 48.02, 37.40, 8.58, and 17.13 mg m-3, respectively (Jiang, 2010; Zhu, 2008). The zooplankton carbon concentrations in spring and sum- mer range from 8.71–60.58 to 0.44–30.25 mg m-3, respec- tively (Su et al., 2014). The phytoplankton and zooplankton carbon pools in the Yellow Sea are 0.77 1.97 and 0.46 0.30 Tg C, respectively (Figure 2).
3.2.2Carbon fixation flux in the Yellow Sea
The carbon fixation rates of the water column in the North Yellow Sea in spring, summer, autumn, and winter are 529.20 (64.5–1498.3), 286.60 (42.7–795.8), 478.90 (100.7–1008.2), and 57.50 (33.3–112.5) mg C m?2 d?1, respectively (Gao, 2009). The average carbon fixation rates in the South Yellow Sea in summer, autumn, and winter are 736.56, 586.00, and 521.52 mg C m?2 d?1, respectively (Fu et al., 2009, 2010; Zheng et al., 2006). The carbon fixation flux in the Yellow Sea is 78.09 (70.89–91.45) Tg C yr?1 (Figure 2).
3.2.3Carbon flux cross the sea-air interface of the Yellow Sea
The atmospheric pCO2 in spring, summer, autumn, and winter in the North Yellow Sea are 388, 370, 377, and 389 atm, respectively (Xue, 2011). The pCO2 in the South Yellow Sea in spring, summer, and winter are 341, 362, and 493 atm, respectively (Zhang et al., 2010). Many in situ investigations have shown that the carbon sources and sinks at the sea-air interface of the Yellow Sea are characterized by significant seasonal change, interannual variability, and huge uncertainty (Tsunogai et al., 1999; Xue, 2011; Xue et al., 2011, 2012; Qu et al., 2013a, 2014, 2015, 2017). Based on
the Bulletin of Marine Environmental Status of China in 2012 (State Oceanic Administration of China, 2013) and the results of a large-scale, high-density survey from 2011 to 2012, the Yellow Sea is a sink of CO2 in winter, spring, and summer, with absorption rates of 26.20, 9.20, and
5.80 kg km?2 d?1, respectively. The Yellow Sea only releases CO2 in winter with a rate of 8 kg km?2 d?1. The CO2 absorbed by the Yellow Sea is ~1.15 1.95 Tg C yr?1 (Figure 2).
3.2.4Carbon depositional flux in the Yellow Sea
Similar to the Bohai Sea, the Yellow Sea also has a stable and high carbon depositional rate. Therefore, the Yellow and Bohai seas are often discussed together in the present study (Liu J et al., 2015; Hu et al., 2016). The annual POC de- positional flux in the Yellow and Bohai seas is 10.30 2.25 Tg C yr?1, which accounts for ~15% of the fixed carbon flux (67.60 9.71 Tg C yr?1; Liu J et al., 2015). The resuspended POC flux from the surface sediment is 8.84 2.00 Tg C yr?1. The net POC depositional flux in the Yellow and Bohai seas is 1.46 Tg C yr?1. It should be noted that the DOC concentration was ignored in the calculation (Liu J et al., 2015). In the sediments of the continental shelf and slope, approximately 40–85% of organic carbon may be resuspended in the sediments of the continental shelf and slope, and a considerable portion of which will be released into the water and back into the carbon cycle (Song et al., 2006). Based on the total carbon burial inventory of the last 100 years, the carbon depositional flux in the Yellow Sea can be ~1.18 Tg C yr?1, among which the organic carbon de- positional flux is ~1.02 Tg C yr?1 (Wang et al., 2018). Re- cently, a comprehensive analysis of the depositional rate of organic carbon in the coastal region of China showed that the average depositional rate of organic carbon in the Bohai and Yellow seas is 15.3 g C m?2 yr?1. The organic carbon de- positional flux in the Yellow Sea is ~3.60 Tg C yr?1 (Figure 2; Hu et al., 2016; Zhao M X et al., 2017), and the con- tribution of marine organic carbon is ~64% (Hu and Zhao, unpublished).
3.2.5Carbon fluxes between the Yellow Sea and the ad- jacent oceans
Based on the average half exchange time of the Bohai Sea and the concentration differences of DIC, DOC, and POC between the Bohai and Yellow seas (Wei et al., 2002; Liu J et al., 2015; Gao et al., 2009; Ji et al., 2009; Shang, 2011; Zhao H D et al., 2017), the DIC, DOC, and POC output fluxes from the Bohai and Yellow seas are 15.85 (13.58–17.89), 1.51 (0.79–2.23), and 0.31 (0.16–2.07) Tg C yr?1, respec-tively (Figures 1 and 2). The net TOC output flux from the Yellow Sea to the East China Sea is 14.70 4.77 Tg C yr?1 (Figure 2; Liu J et al., 2015). Based on the law of mass conservation, more than 90% (>13.20 Tg C yr?1) of the TOC output flux from the Bohai and Yellow seas to the East China Sea is DOC (Liu J et al., 2015; Figure 2).
3.3Carbon pools and fluxes in the East China Sea
3.3.1Seawater carbon pools in the East China Sea
The East China Sea with a wide shelf, enormous terrestrial discharges and open margin to the West Pacific, is featured by strong cross-shelf materials transport. It located at the south of the Yellow Sea, north of the Taiwan Strait, and west of the Ryukyu Islands. The continental shelf area accounts for 66% of the total area (~0.50 106 km2) and the average water depth of the continental shelf is ~72 m. The DIC,spectively (Zhao, 2010). The phytoplankton abundances in the euphotic zone of the North Yellow Sea in spring, sum- mer, autumn, and winter are 9.7 104, 25.5 104, 29.4 104, and 2105.1 104 cells m?3, respectively, with an annual average of 542.4 (0.3–18103.5) 104 cells m?3 (Liu et al., 2013). The highest phytoplankton carbon concentration in the South Yellow Sea was observed in summer (4.62 11.79 104 g C m?3), while the lowest value was in autumn (<1000 g C m?3; Yang and Sun, 2016). The average zoo- plankton carbon concentrations in spring, summer, autumn, and winter in the North Yellow Sea are 48.02, 37.40, 8.58, and 17.13 mg m?3, respectively (Jiang, 2010; Zhu, 2008). The zooplankton carbon concentrations in spring and sum- mer range from 8.71–60.58 to 0.44–30.25 mg m?3, respec- tively (Su et al., 2014). The phytoplankton and zooplankton carbon pools in the Yellow Sea are 0.77 1.97 and 0.46 0.30 Tg C, respectively (Figure 2).DOC, and POC concentrations in the surface and bottom waters are 1832–2023 and 2000–2100 mol kg?1, 0.54– 1.88 mg L?1 (45.00–156.67 mol L?1) and 0.55–1.61 mg L?1 (45.83–134.17 mol L?1), and 8.00–364.00 g L?1 (0.67–30.33 mol L?1) and 8.00–2487.00 g L?1 (0.67–207.25 mol L?1), respectively (Chou et al., 2009, 2013; Liu et al., 1997; Li and Wang, 2011; Tseng et al., 2007). Based on eq. (1), the DIC, DOC, and POC pools in the euphotic zone of the continental shelf of the East China Sea are 573.90 (549.60–606.90), 24.00 (13.50–47.00), and 3.31 (0.20–9.11)Tg C, respectively. The DIC, DOC, and POC pools in the aphotic zone of the continental shelf of the East China Sea are 270.60 (264.00–277.20), 9.57 (6.05–17.71), and 3.60(0.09–27.36) Tg C, respectively.
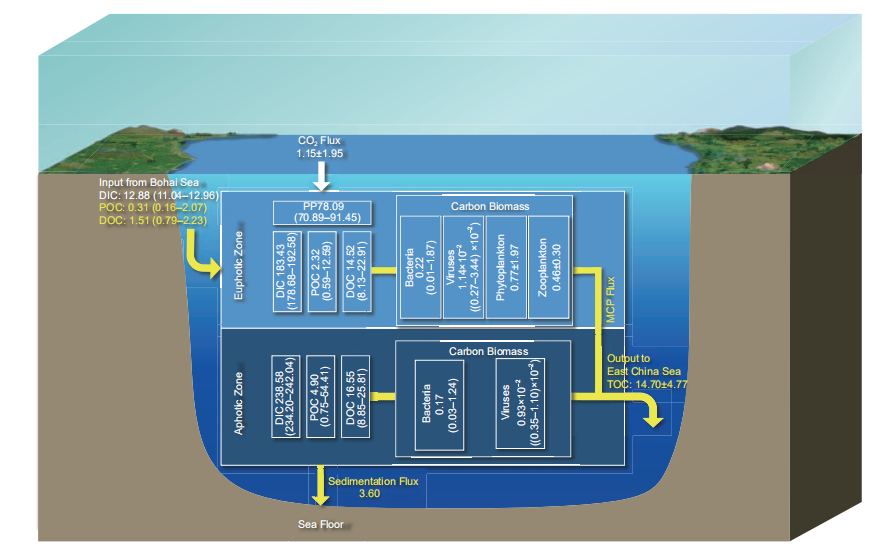
Figure 2 Main carbon pools and fluxes in the Yellow Sea. The white box represents the carbon pool (Tg C); the white arrow represents the DIC fluxes (Tg C yr?1); and the yellow arrow represents the organic carbon flux (Tg C yr?1); see Table 1 for data sources.
In the Northwestern Pacific adjacent to the East China Sea, the upper DIC concentration is ~1960–2000 mol kg?1 (Ya- sunaka et al., 2013), the average ocean DOC concentrations are 53.5 0.2 mol L?1 in the upper 100 m and 43.40 0.30 mol L?1 at 1000 m (Hansell and Carlson, 2001), and the POC concentrations are ~22.80–47.90 g L?1 (1.90– 4.00 mol L?1) above 100 m and <22.80 g L?1 (<1.90 mol L?1) below 100 m (Yang et al., 2004).
The abundances of heterotrophic bacteria, viruses, pico- phytoplankton, and phytoplankton in the continental shelf of the East China Sea are 2.73 105–20.44 105, 4.04 106– 6.57 106, 0.83 103–69.34 103, and 2.04 103–58.22 104 cells L?1, respectively (Xu et al., 2004; Jiao et al., 2005; Zhao, 2010; Lu et al., 2013; Zhang Y R et al., 2016; Zhao et al., 2015). The zooplankton biomass is 0.01–1073 mg m?3 (Xu et al., 2004). Based on eq. (1), the biological carbon pools of heterotrophic bacteria, viruses, phytoplankton, and zooplankton in the euphotic zone of the East China Sea are 0.60 (0.17–1.02), 0.02 (0.02–0.03), 1.52 (0.78–2.26), and 0.07 Tg C, respectively, while in the aphotic zone are 0.21 (0.06–0.35), 0.01, 0.50 (0.36–0.63), and 0.03 Tg C, respec- tively (Figure 3).
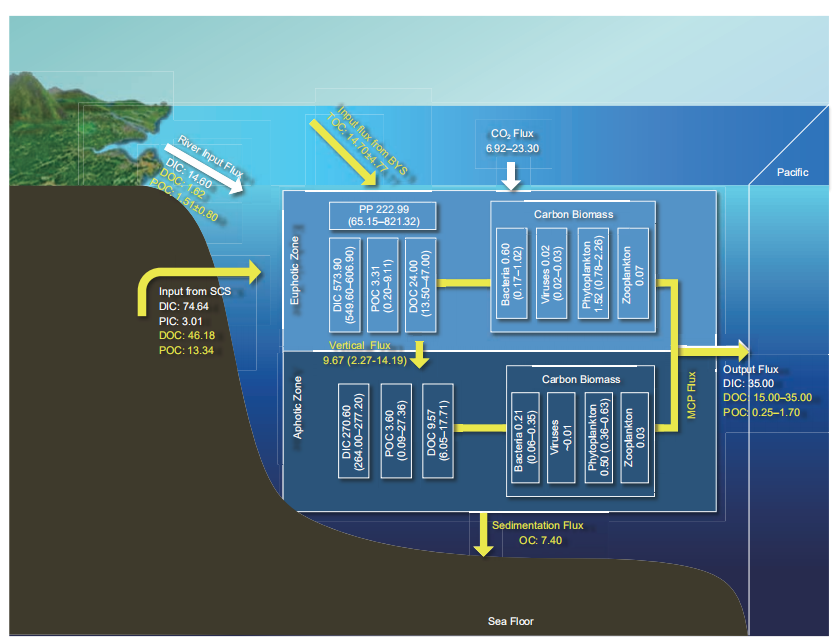
Figure 3 Main carbon pools and fluxes in the East China Sea. The white box represents the carbon pool (Tg C); the white arrow represents the DIC fluxes (Tg C yr?1); and the yellow arrow represents the organic carbon flux (Tg C yr?1); see Table 1 for data sources.
3.3.2Carbon fixation flux of the East China Sea
The carbon fixation rate in the East China Sea is 357–4500.36 mg m?2 d?1 (Lv, 2003; Zhang Y R et al., 2016;
Gong et al., 2003). Two high carbon fixation regions were observed at the frontal edges between the Kuroshio Current and the shallow shelf seawaters and in the upwelling area between the southward coastal current and northward Tai- wan warm current. The low carbon fixation regions were observed in the zones with low transparency near the Changjiang Estuary, in the cold water region north of the Yangtze River mouth, and in the oligotrophic region outside the Kuroshio Current (Jiao et al., 1998). The carbon fixation rate in the Northwestern Pacific adjacent to the East China Sea is 10–30 mmol m?2 d?1 (Yasunaka et al., 2013). The carbon flux of the continental shelf of the East China Sea is 222.99 Tg C yr?1 (65.15–821.32 Tg C yr?1; Lv, 2003; ZhangY R et al., 2016; Gong et al., 2003). The integrated new productivity of the water column in the East China Sea is 158 (14.70–1532.45) mg C m?2 d?1 (Jiao et al., 1998; Wang, 2011b). The new productivity flux of the East China Sea shelf is 28.84 Tg C yr?1 (2.68–279.67 Tg C yr?1).
3.3.3Carbon flux cross the sea-air interface of the East China Sea
The CO2 fluxes at the sea-air interface in the East China Sea are affected by the East Asian monsoon, Pacific Kuroshio, Yangtze River runoff, and anthropogenic factors (e.g., the eutrophication of the coastal waters; Qu et al., 2013b; Tseng et al., 2014), with notable regional and seasonal variations. In 2013, Qu et al. (2013b) reported that the East China Sea appears as a source of atmospheric CO2 (1.50 8.37 mmol m?2 d?1) in autumn. In spring, summer, and winter, it appears as a sink for atmospheric CO2 (?4.94 0.80,?3.67 1.09, and ?6.68 6.93 mmol m?2 d?1, respectively). The annual average CO2 flux in the East China Sea is ap- proximately ?3.16 mmol m?2 d?1 and the CO2 absorbed is6.92 Tg C yr?1 (Figure 3), which indicates a net sink of at-mospheric CO2 (Song et al., 2018). In addition, based on data from 24 cruises for in situ pCO2 studies covering the entire continental shelf of the East China Sea from 2006 to 2011, the East China Sea is a net sink of atmospheric CO2, with the CO2 absorption of 23.30 13.50 Tg C yr?1 (Guo et al., 2015). The overall CO2 absorbed by the East China Sea is 6.92–23.30 Tg C yr?1 (Song et al., 2018; Guo et al., 2015).
3.3.4Carbon depositional flux in the East China Sea
The mean net vertical POC flux at the bottom of the East China Sea in summer is 53.01 mg m?2 d?1, ranging from12.43 to 77.74 mg m?2 d?1 (Sun, 2001). According to the sediment analysis, the total amount of buried carbon in the Fujian-Zhejiang sedimentary zone of the last 100 years is~1.45 Pg, while the organic carbon depositional flux is~6.36 Tg C yr?1 (Wang et al., 2018). The East China Sea shelf has a long margin. The nearshore currents of the East China Sea and the Taiwan warm current drive the transport of coastal sediments, which leads to high depositional fluxes in the East China Sea. The depositional fluxes of organic and inorganic carbon are 7.40 and 5.00–10.00 Tg C yr?1, re- spectively (Figure 3; Deng et al., 2006).
3.3.5Influence of the Yangtze River on the carbon cycle in the East China Sea
The Yangtze River is the main river to the East China Sea. The POC input flux is 1.51 0.80 Tg C yr?1 (Wang et al., 2012), DOC input flux is 1.62 Tg C yr?1 (Wang X et al., 2016), and DIC input flux is 14.60 Tg C yr?1 (Wang X et al., 2016; Figure 3). Carbon input from the Yangtze River is often affected by the precipitation in the river catchment, which is closely related to the thermal state of the tropical Western Pacific Warm Pool and the convective activities in summer. When the tropical Western Pacific Warm Pool warms up, the summer precipitation of the Yangtze River Basin is smaller and vice versa (Huang and Sun, 1994). The amount of precipitation also affects the terrestrial carbon input to the East China Sea.
3.3.6Cross-shelf carbon transport in the East China Sea, carbon exchange between the East China Sea and North- western Pacific
The East China Sea has the widest continental shelf in the temperate zone. Long-distance cross-shelf transport is an important feature of the carbon cycle of the East China Sea, while the carbon flux across the shelf is related to the carbon burial capacity of marginal seas. The PN transect extending from the Yangtze River Estuary to the Western Pacific rim is a typical study site by many researchers, locates at the northwestern of Okinoerabu-jima of the Ryukyu Islands, extends from the Yangtze River Estuary to 125.5 E in northwest-southeast direction, crosscuts the Okinawa Trough, and is perpendicular to the principal axis of the Kuroshio (Kong et al., 2016; Li W et al., 2012). Based on the results for the PN section, the net DIC, DOC, and POC ef- fluxes from the East China Sea to the adjacent oceans in autumn and winter are ~35.00, 15.00–28.00, and 0.25 Tg C yr?1, respectively (Deng et al., 2006). Recent studies have shown that there are three main pathways for the cross-shelf material transport in the Yellow Sea and East China Sea (Yuan and Hsueh, 2010; Qiao L et al., 2017): transport to the southwest of the Jeju Island under the action of southwest ocean current, frontal transport in the coastal area of the Zhejiang and Fujian provinces, and cross-shelf transport under the action of the eastern branch of the Taiwan warm current. There is notable continental shelf transport in the Yellow Sea and East China Sea. In winter, the DIC, DOC, and POC effluxes transported to the open ocean across the continental shelf edge (from the Taiwan Island to the Jeju Island) is 668, 35, and 1.7 Tg C yr?1, respectively (Yuan et al., 2018). As global greenhouse gases continue to increase, the cross-shelf transport increases. The overall net DOC and POC efflux in the East China Sea is 15.00–35.00 and 0.25–1.7 Tg C yr?1, respectively (Deng et al., 2006; Yuan et al., 2018).
The East China Sea is affected by diverse environmental
factors such as the Taiwan Warm currents, Kuroshio, and coastal currents of northern Jiangsu and Fujian-Zhejiang. The Kuroshio Current is one of the most important western boundary currents, transferring saline and warm seawater from low-latitude to mid-latitude regions. Its activities di- rectly affect the carbon distribution in the East China Sea by close carbon exchange with the East China Sea continental shelf. For example, from May to October, the net DIC and DOC inputs from the Kuroshio mainstream to the East China Sea shelf area are 448 and 23 Tg C, respectively, which is beyond the river inputs, while the POC input from the con- tinental shelf of the East China Sea to Kuroshio is 0.43 Tg C (Lu, 2015; Lu et al., 2015). The net DIC, DOC, POC, and particulate inorganic carbon (PIC) inputs from the South China Sea to the East China Sea through the Taiwan Strait are 74.64, 46.18, 13.34, and 3.01 Tg C yr?1, respectively (Chen et al., 2006).
The organic carbon transported from the East China Sea to the Northwestern Pacific is mainly DOC. During long-dis- tance transportation in the East China Sea, labile DOC is utilized by microorganisms and the remaining DOC forms the RDOCt carbon pool (RDOCt, is refractory under specific environmental conditions; Jiao et al., 2014a, 2018b; Ro- binson et al., 2018). A study of bioavailable DOC (BDOC) in the East China Sea (Gan et al., 2016) showed that the BDOC concentration in the East China Sea ranges from 6.80–26.10 mol L?1 (accounting for 9–31% of the original DOC). The concentration difference between the original DOC and BDOC is between 58.00–95.00 mol L?1, ac- counting for 69–91% of the original DOC. Moreover, re- fractory humus-like substances (Gan et al., 2016) are released into the seawater during BDOC utilization. This shows that the East China Sea contains enormous RDOCt (Jiao et al., 2014a, 2018b; Gan et al., 2016). The RDOCt transported to the Northwestern Pacific significantly affects the carbon source/sink pattern of the China Seas.
3.4Carbon pools and fluxes in the South China Sea
3.4.1Seawater carbon pools in South China Sea
The South China Sea is the largest marginal sea at similar latitudes in the global ocean, it includes a large shelf sea in the north and a nearly 4000 m deep basin. The total area of the South China Sea is 3500000 km2, with an average depth of 1212 m. The area deeper than 100 m in the South China Sea is ~2580000 km2, while the basin area deeper than 1000 m is ~1666000 km2 (with an average depth of ~4000 m; http://www.hnszw.org.cn/xiangqing.php?ID=43644). The DIC concentration increases with increasing depth, while the DOC and POC concentrations decrease with increasing depth and tend to stabilize in the deep sea with a depth deeper than 2000 m. The DIC concentrations in the euphotic (0–100 m), mesopelagic (100–1000 m), and bathypelagiczones (>1000 m) of the South China Sea are 1740–2050, 2050–2330, and 2330–2370 mol kg?1, respectively (Chou et al., 2005, 2007b; Cao et al., 2011; Dai et al., 2013). The DOC concentrations in the euphotic, mesopelagic, and bathypelagic zones of the South China Sea are 55.00–85.00, 43.00–66.00, and 38.40–45.00 mol L?1, respectively, while the POC concentrations in the euphotic, mesopelagic, and bathypelagic zones of the South China Sea are 1.60–4.00, 1.30–3.00 and ~1.10 mol L?1, respectively (Dai et al., 2009a; Hung et al., 2007; Wu et al., 2015, 2017; Meng et al., 2017). Based on eq. (1), the DIC pools in the euphotic, mesopelagic, and bathypelagic zones are 7.94 103 (7.31 103–8.61 103), 6.14 104 (5.72 104–6.42 104), and 9.36 104 (9.20 104–9.48 104) Tg C, respectively (Figure 4). The DOC pools in the euphotic, mesopelagic, and bathypelagic zones are 336.00 (231.00–357.00), 1339.03 (1199.55–1841.16), and 1715.31 (1535.39–1799.28) Tg C, respec-tively, while the POC pools in the euphotic, mesopelagic, and bathypelagic zones are 12.60 (6.72–18.90), 61.37 (41.84–83.69), and ~43.98 Tg C, respectively.
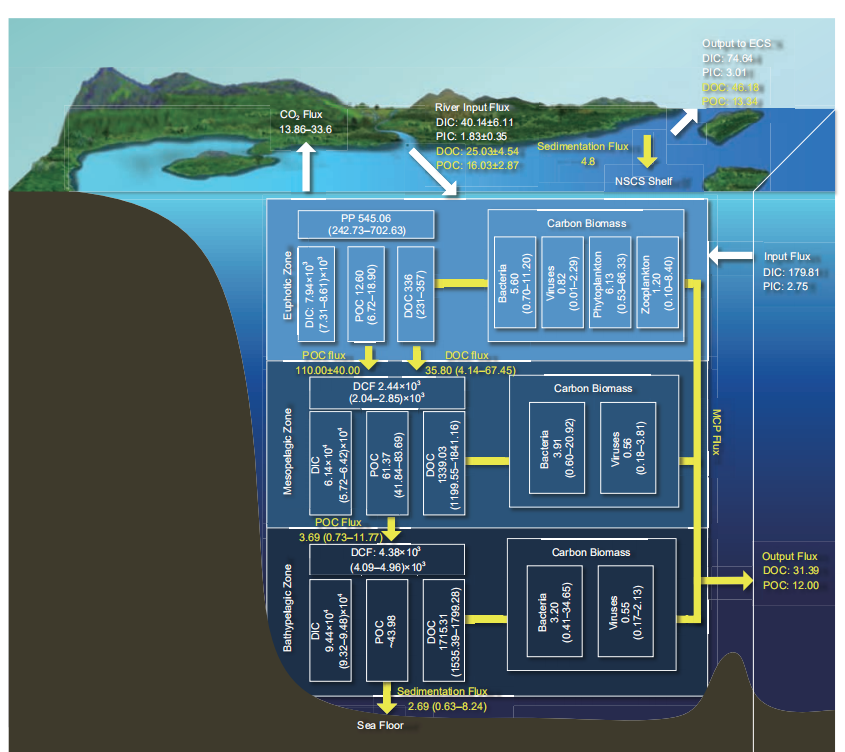
Figure 4 Main carbon pools and fluxes in the South China Sea. The white box represents the carbon pool (Tg C); the white arrow represents the DIC fluxes (Tg C yr?1); and the yellow arrow represents the organic carbon flux (Tg C yr?1); see Table 1 for data sources.
The biomass of heterotrophic bacteria, viruses, phyto- plankton, and zooplankton in the South China Sea decreases from the estuary to the basin, and gradually decreases with increasing depth (Cai et al., 2007; He et al., 2009; Liang et al., 2014; Liang, 2014; Yang, 2000). The heterotrophic bacterial abundances in the euphotic, mesopelagic, and bathypelagic zones are 1.28 104–1.60 106, 1.30 104– 4.50 105, and 6.2 103–5.2 105 cells mL?1, respectively (Cai et al., 2007; Chen et al., 2011; He et al., 2009; Liang et al., 2014; Zhang Z et al., 2016, 2017; Cao, 2017), while the viralabundances are 1.37 105–3.27 107, 3.8 105–8.2 106, and 2.6 105–3.2 106 mL?1, respectively (Chen et al., 2011; He et al., 2009; Liang et al., 2014; Liang, 2014; Zhang Z et al., 2016, 2017). The heterotrophic bacterial carbon pools in the euphotic, mesopelagic, and bathypelagic zones of the South China Sea are 5.60 (0.70–11.20), 3.91 (0.60–20.92), and 3.20(0.41–34.65) Tg C, respectively (Figure 4), while the viral carbon pools in the euphotic, mesopelagic, and bathypelagic zones of the South China Sea are 0.82 (0.01–2.29), 0.56 (0.18–3.81), and 0.55 (0.17–2.13) Tg C, respectively (Figure4; Table 2).
The concentrations of Chl a in the euphotic zone during spring, summer, autumn, and winter are 0.05–1.47, 0.03– 3.71, 0.16–3.00, and 0.05 to 3.79 g L?1, respectively (Chen et al., 2012; He et al., 2009; Ning et al., 2004). In most parts of the South China Sea, picophytoplankton accounts for
~80% of the total Chl a (65.19–87.04%; Li J et al., 2017). Prochlorococcus is the most abundant group of picophyto- plankton in the South China Sea (Yang, 2000; Chen et al., 2009; Liu H et al., 2007; Tseng, 2005; Wong et al., 2007; Liang et al., 2014). The phytoplankton abundances in sum- mer and winter are 0.09 103–6001.78 103 and 0.08 103– 65.62 103 cells L?1, respectively (Ning et al., 2004; Ma and Sun, 2014). Based on the Chl a concentration and eq. (1), the phytoplankton carbon pool in the South China Sea is 6.13(0.53–66.33) Tg C (Figure 4). The dry weight of zooplankton in the northern South China Sea in spring is 3.39–72.00 mg m?3; in other seasons, it is 1.00–20.00 mg m?3 (Chen et al., 2015). The range of zooplankton carbon bio- mass is 0.30–23.90 mg C m?3. The zooplankton carbon pool in the euphotic zone of the South China Sea is 1.20 (0.10– 8.40) Tg C (Figure 4).
3.4.2Carbon fixation flux in the South China Sea
The water column-integrated carbon fixation rates of the South China Sea in the spring, summer, autumn, and winter are 0.26, 0.19, 0.28, and 0.55 g C m?2 d?1, respectively. In spring, the carbon fixation rates of the continental shelf, continental slope, and basin are 0.72, 0.34, and0.49 g C m?2 d?1, respectively. In autumn, the carbon fixation rates of the continental shelf and basin are 0.45 andg C m?2 d?1, respectively (Chen, 2005; Liu K K et al., 2002, 2007; Ning et al., 2004). A high value of the carbon fixation rate in the South China Sea is usually observed in winter due to the enhanced vertical mixing caused by the strong northeastern monsoon in winter. The nutrients sup- plied from the lower layer to the surface promote the growth of phytoplankton (Chen, 2005; Xie et al., 2015). The average carbon fixation rate is 155.73 (69.35–200.75) g C m?2 yr?1 (Chen, 2005; Xie et al., 2015). The carbon fixation flux in the euphotic zone of the South China Sea is 545.06 (242.73– 702.63) Tg C yr?1 (Figure 4). The new productions in the basin of the South China Sea in spring, summer, autumn, and winter are 0.07, 0.03, 0.05, and 0.26 g C m?2 d?1, respec- tively. In spring, the new productions in the continental shelf, continental slope, and basin are 0.16, 0.10, and0.15 g C m?2 d?1, respectively. In autumn, the new produc- tions in the continental shelf and basin are 0.14 and0.09 g C m?2 d?1, respectively (Chen, 2005). The average value of the new production is 37.41 (10.95– 94.90) g C m?2 yr?1 (Chen, 2005); the new production flux in the euphotic zone of the South China Sea is 130.93 (38.32– 332.15) Tg C yr?1.
Chemoautotrophic microorganisms (bacteria and archaea) do not require light energy for carbon fixation and are widely distributed in marine water and sediments. In some seawater, the carbon fixation flux from chemoautotrophic micro- organisms can be equal to the photosynthetic carbon fixation of phytoplankton in the euphotic zone. There are few studies on chemoautotrophic carbon fixation in the South China Sea, especially in the deep sea. Only one paper has been published and showed that the chemoautotrophic carbon fixation in the South China Sea is relatively high. The integrated che- moautotrophic carbon fixation rate above 1500 m reaches 196 mg C m?2 h?1 and the highest chemoautotrophic carbon fixation rate in the South China Sea can reach up to 10–100 times that of the Atlantic (Reinthaler et al., 2010; Zhou et al., 2017). Based on the data of Zhou et al. (2017), the che- moautotrophic carbon fixation fluxes in the meso- and bathypelagic zones of the South China Sea are 2.44 103 (2.04 103–2.85 103) and 4.38 103 (4.09 103–4.96 103) Tg C yr?1, respectively (Figure 4; at present, research about the chemoautotrophic carbon fixation rate in the South China Sea is very limited; therefore, the uncertainty in this estimate is large). The carbon fixation capacity of che- moautotrophic microorganisms needs to be further clarified.
3.4.3Carbon flux cross the sea-air interface of the South China Sea
The results of both model estimation and voyage survey showed that the South China Sea is a weak to moderate source of atmospheric CO2 and only the offshore area of the Pearl River Estuary is a weak sink of CO2 (Chai et al., 2009; Zhai et al., 2013). The carbon release rate of the South China Sea is 0.33 mole m?2 yr?1 based on biogeochemical models. Based on the total area of the South China Sea (3.50 106 km2), it is estimated that the CO2 released from the South China Sea is ~13.86 Tg C yr?1 (Chai et al., 2009). The results from the 14 field surveys in the South China Sea from 2003–2008 showed that the CO2 released from the northern SCS slope/basin, west of the Luzon Strait, and central/southern South China Sea are ~0.46 0.43, 1.21 1.48, and 1.37 0.55 mole m?2 yr?1, respectively, while the CO2 ab- sorbed in the area off the Pearl River Estuary is –0.44 0.65 mole m?2 yr?1 (the surveyed area is 6.80 104 km2; the region absorbs ~0.36 Tg C yr?1 from the atmosphere). The above-mentioned four regions release 18 10 Tg C yr?1 to the atmosphere. If extrapolated to the main body of the South China Sea (excluding the Northern and Thailand bays; 2.50 106 km2), the CO2 released from the main body of the South China Sea is 33.60 51.30 Tg C yr?1 (Zhai et al., 2013). To summarize, the CO2 released from the South China Sea is ~13.86–33.60 Tg C yr?1 (Figure 4; Chai et al., 2009; Zhai et al., 2013).
3.4.4Carbon depositional fluxes in the South China Sea
The estimated POC vertical export rate in the South China Sea varies from 20.00 to 255.60 mg C m?2 d?1 in different water layers (Sun et al., 2016). The POC export below the euphotic zone in the South China Sea is derived from esti- mating the results in the coastal shelfs and basins, respec- tively (Liu et al., 2018). Based on the 234Th-238U imbalance, the POC export rate from the euphotic zone in the northern shelf sea of South China Sea is estimated to be 4.60–66.70 mmol C m?2 d?1, with an average of 20.00 9.80 mmol C m?2 d?1 (Chen, 2008; Cai et al., 2015; Liu et al., 2018). Based on the isotopic disequilibrium method and sediment traps, the POC export rate below the euphotic zone in the South China Sea Basin is estimated to be 0.80–21.00 mmol C m?2 d?1, with an average of 5.40 2.50 mmol C m?2 d?1 (Cai et al., 2002, 2015; Ho et al., 2009; Hung et al., 2007; Wei et al., 2011; Wong et al., 2007; Yang et al., 2009; Liu et al., 2018). The total POC export flux below the euphotic zone in the South China Sea is 110.00 40.00 Tg C yr?1 (Liu et al., 2018). The sediment trap data show that the POC depositional rate at 1000 m is ~0.78–12.48 mg C m?2 d?1, and the average value is 0.61–6.67 mg C m?2 d?1 in the deep ocean (3226–3770 m) (Chen et al., 1998; Ran et al., 2015; Li H et al., 2017). Hence, the POC depositional flux in the shallow water of the South China Sea with depths between 100 and 1000 m is 1.31 (0.26–4.18) Tg C yr?1, and the POC depositional fluxes at 1000 m and in the deep sea of the South China Sea Basin are 2.38 (0.47– 7.59) and 1.38 (0.37–4.06) Tg C yr?1, respectively. Due to freshwater inputs from rivers such as the Pearl River, the organic carbon sedimentation rate of the northern shelf sea of the South China Sea is 14.10 g C m?2 yr?1, which is much higher than that in the South China Sea Basin, and the or- ganic carbon sedimentation flux of the northern shelf sea is4.80 Tg C yr?1 (Hu and Zhao, unpublished). In summary, the organic carbon depositional flux in the South China Sea is a combination of the organic carbon depositional flux in the northern shelf sea of the South China Sea, POC depositional flux in the seawater with depths between 100 and 1000 m,and POC depositional flux in the deep-sea basin of the South China Sea; it is ~7.49 (5.43 to 13.04) Tg C yr?1 (Figure 4).
3.4.5Riverine carbon inputs into the South China Sea
River input is an important factor affecting the carbon cycle in the South China Sea. According to carbon discharge data of 55 rivers into the South China Sea, the riverine DIC, DOC, POC, and PIC input fluxes into the South China Sea are 40.14 6.11, 25.03 4.54, 16.03 2.87, and 1.83 0.35 Tg C yr?1, respectively, with a total riverine carbon input of 83.00 8.10 Tg C yr?1 (Figure 4; Huang et al., 2017). It accounts for 6.2–10.3% of the world’s riverine carbon input, while the South China Sea accounts for only 1% of the world’s ocean area and its drainage area accounts for only 2.2% of the global land. This reveals the importance of terrestrial carbon input to the carbon flux of the South China Sea.
In addition, recent studies have shown that submarine groundwater discharge (SGD) carbon flux may be one of the important uncertainties affecting coastal carbon budgets. However, there is only limited research on the SGD carbon fluxes of China Seas. The SGD DIC input flux into the northern South China Sea ranges from 1.84 to 4.16 Tg C yr?1, accounting for ~23% to 53% of the riverine DIC input fluxes (Liu et al., 2012). The SGD DIC input flux of the Jiulong River is about 45–110% of the riverine DIC input fluxes (Wang G et al., 2015).
3.4.6Carbon fluxes between the South China Sea and the adjacent oceans
The carbon exchange between the South China Sea and the adjacent oceans (Northwestern Pacific, India Ocean, and East China Sea) is very important for the carbon cycles in the South China Sea. Carbon exchange between the South China Sea and the adjacent oceans were reported in some early studies (Hong and Dai, 1994; Han and Lin, 1997; Chen and Wang, 1998; Liu, 2001; Chen et al., 2006). Based on carbon exchange fluxes through the Taiwan Strait, Luzon Strait, Mindoro Strait, and Sunda Shelf determined by mass balance method, the net DOC, POC, and PIC effluxes from the South China Sea to the adjacent oceans are 31.39, 12.00, and2.75 Tg C yr?1 respectively, while the DIC influx from the adjacent oceans to the South China Sea is 179.81 Tg C yr?1 (Figure 4; Chen et al., 2006). The DIC, DOC, POC, and PIC effluxes from the South China Sea to the East China Sea through the Taiwan Strait are 74.64, 46.18, 13.34, and3.01 Tg C yr?1, respectively (Figures 4 and 5; Chen et al., 2006). Recently, according to the TOC concentrations (with its magnitude close to DOC) on the both sides of the Luzon Strait and the “sandwich” water exchange model for the Luzon Strait, the carbon exchange fluxes through the Luzon Strati are re-estimated, which shows the TOC input fluxes from the Northwestern Pacific to the South China Sea in the upper and lower layers and the TOC efflux from the South
China Sea to the Western Pacific Ocean in the middle layer. The TOC concentration in the middle layer (between 1000 and 1500 m) is significantly higher in the South China Sea than that in the Northwestern Pacific. The TOC effluxes from the South China Sea to the Northwestern Pacific through the upper, middle, and lower layers of Luzon Strait are –107.10 54.60, 54.70 15.00, and –16.40 13.10 Tg C yr?1, respec-tively. Thus, the total TOC input flux from the Northwestern Pacific to the South China Sea through the Luzon Strait is 68.80 58.00 Tg C yr?1 (Dai et al., 2009a; Wu et al., 2015). Based on the application of the same methods to the relevant DIC concentration gradients, the net DIC input flux into the South China Sea through the Luzon Strait was 69.6 Tg C yr?1 (Liu et al., 2018). The carbon exchange fluxes between the South China Sea and the Northwestern Pacific through the Luzon Strait is with a large uncertainty because of the sea- sonal and interannual variations of the ocean currents (Wu et al., 2015). In future, the carbon exchange fluxes between the South China Sea and the adjacent oceans should synthesize the fluxes through the Luzon Strait with the long-term, large- scale exchange fluxes through the Taiwan Strait, Mindoro Strait, Sunda Strait, and other pathways, and it will be the basis to accurately quantify the organic carbon exchange fluxes between the South China Sea and the adjacent oceans. The organic carbon exchange between the South China Sea and the adjacent oceans is dominated by the DOC fluxes (Chen et al., 2006; Wu et al., 2015), which is not fully uti- lized by the local microorganisms and therefore contributes to the RDOCt pool of the South China Sea (Jiao et al., 2014a, 2018b; Robinson et al., 2018). Incubation experiments showed that the proportion of BDOC accounts for 6–23% of DOC in the South China Sea; the labile DOC available for microbial utilization accounts for 4–9% of the DOC in the South China Sea (Pearl River Estuary>continental shelfs=ocean basins>Luzon Strait); and the semi-labile DOC ac- counts for 2–14% of DOC in the South China Sea (Pearl River Estuary>continental shelfs>ocean basins). The con- sumption rate of DOC in the South China Sea varies from0.05 to 0.39 mol L?1 d?1 and is higher in the Pearl River Estuary than in the open sea (Liu J et al., 2014; Cao, 2017). Similar BDOC result is reported in the East China Sea (Liu J et al., 2014; Gan et al., 2016; Cao, 2017), indicating RDOCt accounts for 69–94% of the DOC in the South China Sea and outer East China Sea. The RDOCt can be exported from the South China Sea to the Northwestern Pacific through the Luzon Strait in 1000–1500 m deep intermediate water (Wu et al., 2015), affecting the carbon budgets of the China Seas.
A huge amount of seawater and DIC are transported from the Northwestern Pacific to the South China Sea (Chen et al., 2006; Liu et al., 2018), which causes upwelling in the northern South China Sea and further impacts the carbon storage and carbon flux at the sea-air interface in the South China Sea. The upwellings caused by mesoscale eddies in the northern South China Sea influenced the carbon storage efficiency of the BP and MCP (Jiao et al., 2014b). Although the upwelling leads to high DIC concentrations which is released as CO2 at the sea-air interface, upwelling also in- creases the nutrient concentrations in the euphotic zone and stimulates phytoplankton growth, which in turn increases the CO2 absorption at the sea-air interface and increases the carbon fixation, benefits the organic carbon export from the euphotic zone to the deep ocean, and thereby increases the BP efficiency. In comparison, the MCP efficiency is rela- tively high in the oligotrophic sea (Jiao et al., 2014b; Poli- mene et al., 2016, 2018). In situ incubation experiments suggested that RDOCt is higher under low-nutrient condi- tions (Liu J et al., 2014; Gan et al., 2016; Cao, 2017).
In addition, the subsurface water (100–600 m) in the South China Sea with high DIC/TA ratio is exported to the west side of the Kuroshio Current, joins the main stream of the Kuroshio Current, and is transported northward. This high- CO2 seawater may invade into the shelf sea of the East China Sea and impact the carbon budgets of the East China Sea (Chou et al., 2007a).
3.5 Overall carbon fluxes of sea-air interface, river input, carbon deposition and export in the China Seas
Comprehensive analysis of the carbon flux data of the Bohai Sea, Yellow Sea, East China Sea, and South China Sea shows that the Yellow Sea and East China Sea absorb about 1.15 and 6.92–23.30 Tg C yr?1 of atmospheric CO2, respectively, while the Bohai Sea and South China Sea release 0.22 and 13.86–33.60 Tg C yr?1 into the atmosphere, respectively. The net flux of the China Seas CO2 release to the atmosphere is ~6.01–9.33 Tg C yr?1 (Figure 4). If only the carbon flux at the sea-air interface is considered, it appears that the China Sea is a weak “source” of atmospheric CO2. This is mainly because of the input of a large amount of DIC from rivers and adjacent oceans especially in the South China Sea. The DIC fluxes from the rivers surrounding the China Seas to the Bohai Sea and Yellow Sea, East China Sea, and South China Sea are 5.04, 14.60, and 40.14 Tg C yr?1, respectively. The total value is 59.78 Tg C yr?1 (Figure 5), which is far beyond the carbon flux of CO2 released from the China Seas into the atmosphere. The net DIC input flux from adjacent oceans to the China Seas is as high as 144.81 Tg C yr?1 (the DIC flux from adjacent oceans to the East China and South China seas are ?35.00 and 179.81 Tg C yr?1, respectively), which is far beyond the DIC fluxes from the rivers and dominates the “source” of atmospheric CO2 of the China Seas. Based on the deduction of the CO2 released from the sea-air interface of the China Sea, the annual input flux of DIC into the carbon pool of the China Seas is ~204.59 Tg C yr?1. The question is why the increase of the DIC in the China Seas does not lead to an increase of the carbon pool in the coastal waters ofChina. Possible interpretations are: (1) The uncertainty of the DIC flux between the South China Sea and adjacent oceans is as high as 20%. For example, the uncertainty of the DIC output flux from the South China Sea to the Western Pacific reaches 1032 Tg C yr?1 (Chen et al., 2006). This uncertainty affects the estimation of the carbon budget of the China Seas.
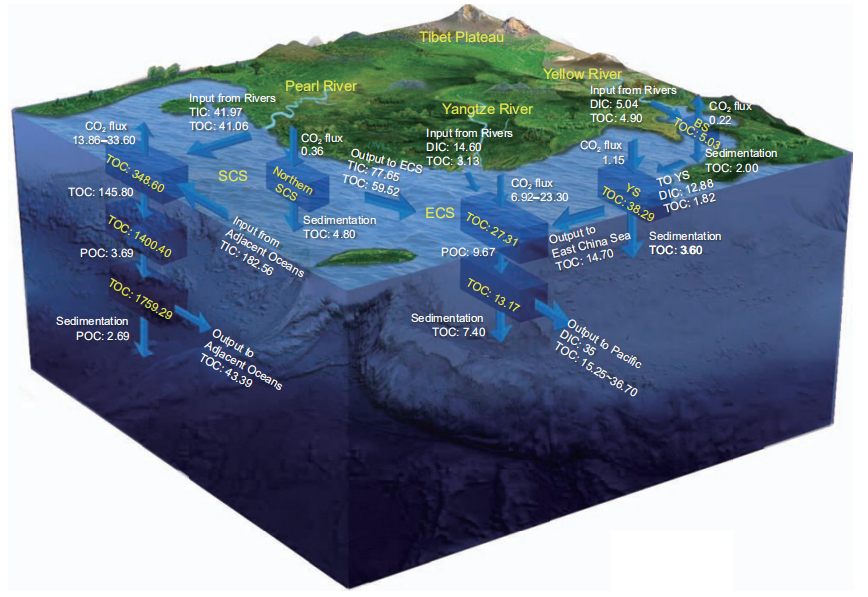
Figure 5 Main carbon fluxes in the China Seas. The white box represents the carbon pool (Tg C); the arrow represents the carbon fluxes at the sea-air interface, carbon export, carbon sedimentation, and carbon exchange (Tg C yr?1); See table 1 and Figures 1–4 for data sources.
(2)A part of the DIC input was converted into organic car- bon through photosynthesis, stored in the deep sea, sedi- mented through BP-mediated vertical output and organic carbon deposition, or was exported to adjacent oceans through MCP-mediated DOC transformation. (3) The re- maining part of the DIC, which could not be stored or ex- ported by the BP and MCP, may accumulate within the water column of the China Seas and slowly cause ocean acid- ification. Although the output flux of POC from the euphotic zone of the South China Sea is relatively high (up to 110 Tg C yr?1), 99% of the POC was remineralized to DIC by microorganisms in the meso- and bathypelagic zones of the South China Sea. Thus, it may indirectly lead to the accumulation of DIC in the meso- and bathypelagic zones of the South China Sea and to the dissolution of aragonite on the continental slope. This may lead to slow acidification of the water column of the South China Sea (Chen et al., 2006, 2017). Ways to balance the absorption of DIC of the China Seas mainly include POC deposition and organic carbon export to adjacent oceans. The POC depositional fluxes from the Bohai Sea, Yellow Sea, East China Sea, and South China Sea are 2.00, 3.60, 7.40, and 7.49 Tg C yr?1, respectively. The DOC efflux from the East China Sea to the North- western Pacific is about 15.25–36.70 Tg C yr?1, while43.93 Tg C yr?1 from the South China Sea to the adjacent oceans. Based on the combination of the POC depositional flux and DOC effluxes from the China Seas to adjacent oceans, the annual net output of organic carbon from the seawater carbon pools of the China Seas reaches 77.56–99.01 Tg C yr?1. It plays an important role in slowing down the growth of the DIC pool and alleviating ocean acidifica- tion in water columns of the China Seas.
The output of organic carbon in the China Seas is domi- nated by the DOC effluxes. The DOC efflux from the East China and South China seas to the Northwestern Pacific and adjacent oceans of the South China Sea is ~46.39–66.39 Tg C yr?1 (Figure 5). Most of the exported DOC is RDOCt produced by the microorganisms (Jiao et al., 2014a, 2018b). Incubation experiments also showed that the pro- portion of BDOC in the East China Sea (9–31%) and South China Sea (6–23%) accounts for less than 31% of DOC and RDOCt accounts for 69–94% of the DOC (Liu J et al., 2014; Gan et al., 2016; Cao, 2017). The proportion of BDOC to DOC is smaller at the shelf edge of the East China Sea and in the 1000–1500 m deep water of the Luzon Strait (Liu J et al., 2014; Gan et al., 2016; Wu et al., 2015; Cao, 2017). This indicates that the DOC exported from the China Sea to ad-jacent oceans is mainly RDOCt, which also implies that the MCP plays an important role in the export of organic carbon from the China Seas.
3.6 Carbon pools and fluxes of mangroves, salt mar- shes, seagrass beds, and coral reefs
The mangrove forest covers ~227 km2 of the Chinese off- shore region. The mangrove carbon pool is 6.91 0.57 Tg C, of which 82% and 18% are found in the surface soil (1 m) and mangrove biomass, respectively (Liu H et al., 2014; Wang X J et al., 2016). The global average mangrove carbon depositional rate is 174.00 g C m?2 yr?1 (Laffoley and Grimsditch, 2009) and the carbon depositional flux of Chi- nese mangroves is 0.04 Tg C yr?1. If use the mean mangrove carbon depositional rate in China (209.00–661.00 gC m?2 yr?1; Zhang et al., 2013; Tang et al., 2018), the carbon depositional flux of Chinese mangroves is 0.10 (0.05–0.15) Tg C yr?1. Recently estimated results showed that the Chinese mangrove carbon pool is 30.20 9.60 Tg C and the carbon depositional flux is ~0.09 0.03 Tg C yr?1 (Lin et al., unpublished). The area of China’s coastal wetland is~5.94 104 km2 (Wang X J et al., 2016), while the area of saltmarsh wetlands, such as Phragmites spp. beach, Suaeda beach, Scirpus mariqueter beach, and Spartina alterniflora beach, is approximately 1206.54 km2 (Zhou C H et al., 2016). The carbon depositional rate of coastal salt marsh ecosystems varies greatly along Chinese coast. The average carbon depositional rate of Phragmites wetland of East Chongming Island is 1110.00–2410.00 g C m?2 yr?1, that of the Scirpus mariqueter beach is ~350.00–910.00 gC m?2 yr?1, that of the Phragmites marsh in the Yellow River Delta is 700.00 160 g C m?2 yr?1, and that of reed wetland in the Liaohe River Delta is ~1770.00 g C m?2 yr?1 (Cao et al., 2013; Mei and Zhang, 2008; Suo et al., 2010; Tang et al., 2014; Tang et al., 2018; Zhang X L et al., 2012). Using the average carbon depositional rate of global salt marshes (218.00 g C m?2 yr?1; Mcleod et al., 2011) for cal- culation, the carbon depositional flux of Chinese salt marsh is 0.26 Tg C yr-1. Based on the carbon depositional rate of Chinese salt marshes (350.00–2410.00 g C m?2 yr?1), the carbon depositional flux of Chinese salt marsh is 1.64 (0.42–2.87) Tg C yr?1. Seagrass in China’s coastal waters cover~99.69 km2 (Jiang et al., 2017; Zheng et al., 2013; Qiu et al., 2014; Tang et al., 2018; Zhou Y et al., 2016) and the total depositional carbon pool of seagrass in Hainan Island is40858.50 t C (Jiang et al., 2017). Taking the average carbon depositional rate of the global seagrass (138 g C m?2 yr?1; Mcleod et al., 2011) for calculation, the carbon depositional flux of seagrass in China is 0.01 Tg C yr?1. According to the ratio of the carbon depositional flux in seagrass (6 Tg C yr?1) and exported DOC flux (355 Tg C yr?1) (Krause-Jensen and Duarte, 2016) of the global macroalgae model, the estimated DOC export flux from seagrass beds in China is0.59 Tg C yr?1. If the RDOCt ratio of 69–94% (Gan et al., 2016; Cao, 2017) is applied, the RDOCt efflux from the seagrass beds is ~0.50 Tg C yr?1.
Coral reefs have a very high carbon fixation efficiency and are called “the rainforest in the sea.” Coral reefs in the China Seas are mainly distributed in the South China Sea (Chen, 1956), including Nansha, Xisha, Zhongsha, Dongsha Is- lands, coastal areas of Hainan Island and continental shelf of the South China, and southern coast of the Taiwan Island. The total area of coral reefs in the South China Sea is~8000 km2 (Yu, 2012), accounting for 1.29% of the total world coral coverage (Smith, 1978). A study of the CO2 sea- air flux of coral reefs in the South China Sea showed that the pCO2 of the coral reefs area of Yongxing Island had a notable daily cycle in the spring of 2006 and formed a weak source of atmospheric CO2 (~1.48 mmol m?2 d?1; Dai et al., 2009b). The Fiery Cross Reef, Yongxing Island, and Luhuitou fringing reef release ~0.4, 4.7, and 9.8 mmol CO2 m?2 d?1, respectively (Yan et al., 2011). In addition, the coral reef area in Sanya acts as a source of atmospheric CO2 in different seasons (spring: ~5.3 mmol m?2 d?1, summer: 9.6 mmol m?2 d?1, au- tumn: 3.5 mmol m?2 d?1, and winter: 2.7 mmol m?2 d?1) (Yan et al., 2016). Based on the literature and unpublished pCO2 data, the coral reefs in the South China Sea release ~0.60–2.10 Tg C yr?1 into the atmosphere (Yan et al., 2017).
The carbon cycle in coral reefs involves mainly two pro- cesses: inorganic carbon metabolism (calcification/dissolu- tion) and organic carbon metabolism (photosynthesis/ respiration). The annual CaCO3 depositional flux of coral reefs accounts for 23–26% of that of the whole world (Yan et al., 2009). The calcification flux of coral reefs can be cal- culated based on the growth rate of the coral skeleton, ske- leton density, and coral coverage rate (Yu and Zhao, 2009). The estimated calcification flux of coral reefs in the South China Sea is upto 21.40 Tg yr?1, equivalent to 2.60 Tg C yr?1 (Yan et al., 2017). Organic carbon in the reefs can be buried under sediment or outputted to adjacent seas. The deposi- tional flux of organic carbon in the coral reefs of the South China Sea is ~0.04 Tg C yr?1, while the export flux of or- ganic carbon to adjacent seas is ~0.19 Tg C yr?1 (Yan et al., 2017). Overall, the carbon sequestration flux of the coral reefs in the South China Sea is ~2.83 Tg C yr?1 considering the coral reef calcification flux, organic carbon deposition, and export flux. Although the coral reefs in the South China(0.60–2.10 Tg C yr?1), carbon sequestration fluxes com- pletely offset the release flux of CO2. Because there is not much data available on carbon pools and fluxes of coral reefs in the South China Sea, these estimates have a large un- certainty and further in situ long-term series monitoring is necessary. The RDOCt output of coral reef systems is lacking systematic research but is an important aspect that needs to be discussed in the future.
3.7Carbon fluxes of marine macroalgae cultures in coastal waters
The mariculture production in China has increased since the 1960s. At present, China’s marine aquaculture area and output are ranked first in the world. In 2016, the total output of mariculture in China reached 1.96 107 tons, ~30% higher than the total output in 2005 (Fisheries Administration Bu- reau of the Ministry of Agriculture, 2017). By 2014, the total output of mariculture in China accounted for 62% (FAO, 2016) of the world; shellfish and macroalgae culture ac- counted for more than 85% of the total output of mariculture in China (Fisheries Administration Bureau of the Ministry of Agriculture, 2017). Macroalgae culture is an important component of fisheries carbon sequestration. There are many types of macroalgae cultures in China. Kelp (Laminaria ja- ponica) is the prominent contributor to fisheries carbon se- questration; the contribution rate of kelp to the carbon sink of the total macroalgae is ~73%. Wakame, nori, and Gracilaria are some of the other cultivated macroalgae. The annual output of these four macroalgae types accounts for more than 97% of the total macroalgae mariculture output in China (Ji and Wang, 2015). The total macroalgae mariculture was 2.17 106 tons in 2016. Assuming that the carbon content of all macroalgae is the same and taking the carbon content of Laminaria japonica (31.2% of the dry weight) as a reference, the removable organic carbon by Chinese macroalgae mar- iculture in 2016 is ~0.68 Tg C yr?1 (Zhang Y Y et al., 2017). Chinese and foreign researches about fisheries carbon se- questration primarily focused on removable organic carbon through macroalgae harvesting (Tang and Liu, 2016), while the POC deposition and DOC export, which are closely re- lated to the microbial activity during macroalgae mar- iculture, are less understood. According to the depositional rate and sediment carbon content (Cai et al., 2003; Xia et al., 2014), the POC depositional flux of macroalgae in China is>0.14 Tg C yr?1 (Zhang Y Y et al., 2017). Studies on the carbon cycle of global wild macroalgae indicate an annual depositional and export fluxes of organic carbon of 173 Tg C yr?1. A total of 90% of the depositional and export fluxes are transported to the deep sea and the carbon is pri- marily sequestrated through DOC export below the mixed layer (the annual export flux is 117 Tg C yr?1). In contrast,(Krause-Jensen and Duarte, 2016). Zhang et al. (2017) esti- mated that the carbon fixation flux of China’s macroalgae culture is ~3.52 Tg C yr?1. The annual released DOC flux from macroalgae culture in China is >0.82 Tg C yr?1. Be- cause 69–94% of the total DOC is RDOCt (Liu J et al., 2014; Gan et al., 2016; Cao, 2017) in the East China and South China seas, the total RDOCt efflux from macroalgae mar- iculture in the China Seas is >0.57 Tg C yr?1. The results indicate that the RDOCt efflux om macroalgae culture to adjacent seas are comparable to the removable organic car- bon flux of macroalgae culture and thus MCP is a very im- portant contributor to the carbon sequestration of macroalgae mariculture (Zhang Y Y et al., 2017).
3.8Effects of ocean acidification on the biology and ecological effects on the carbon cycle
Due to the dramatic increase of the atmospheric CO2 con- centration since the industrial revolution, the ocean continues to absorb anthropogenic CO2 emissions and the ocean CO2 sink in 2017 is 2.4 Gt yr?1 (Le Qu r et al., 2018). Simulta- neously, the absorption of atmospheric CO2 can result in ocean acidification which is now the fastest in the past 300 million years (H?nisch et al., 2012). The extinction of marine species 252 million years ago might be related to paleoocean acidification events (Garbelli et al., 2017). In shallow-water CO2 vents, the biomass and diversity decreased with the decrease of the pH (Fabricius et al., 2011). These results indicate that ocean acidification could affect the organisms and ecosystems both in the past and at present. By the end of the 21st century, ocean acidification will reduce the average pH of the upper ocean by 0.4 (the H+ concentration will increase by 150%; Gattuso et al., 2015) and will endanger marine organisms and the service function of marine eco- systems (IGBP et al., 2013). Chinese researchers conducted several studies about ocean acidification in the Bohai Sea, Yellow Sea, East China Sea, South China Sea, and coral reef systems and showed that ocean acidification is an ubiquitous phenomenon in the coastal waters of China (State Oceanic Administration of China, 2013; Chen et al., 2006; Liu H K et al., 2015; Tang et al., 2013; Wang et al., 2014; Zhai et al., 2012, 2014).
Ocean acidification can affect many types of marine or- ganisms. Acidification can affect the assimilation of marine autotrophic organisms, thereby influencing the marine car- bon cycle (Agusti et al., 2015; Xue et al., 2016). Due to rising CO2/acidification, the diatom abundance decreases and the carbon fixation rate of phytoplankton decreases in surface waters of the South China Sea. The response of diatoms to acidification is controlled by the solar radiation intensity and the distribution depth. Acidification reduces the growth rates of diatoms under high light conditions and accelerates growth rates of diatoms under low light conditions (Gao etal., 2012). A study about the different species within the genus Thalassiosira showed that the response of coastal species, Thalassiosira weissflogii, to acidification was completely different from the response of pelagic species, Thalassiosira oceanica (Li et al., 2016). For heterotrophic organisms, the impact of acidification on bacteria remains controversial (Wang Y et al., 2015). The bacteria could re- lease CO2 during their degradation of organic matter, which could enhance the acidification of seawater (Cai et al., 2011). Studies at the ALOHA station in Hawaii showed that the bacterial productivity lags behind the carbon fixation rate by 1–2 months and has a notable response to warming, but it is not affected by short-term seawater acidification (Vivani, 2016). However, some studies also showed that ocean acidification causes bacteria to consume additional energy, which may affect the efficiency of the MCP (Bunse et al., 2016). With respect to secondary producers, acidification may affect the metabolism of plankton and the transmission of energy and substance in the food chain, thereby affecting ecological services (Li and Gao, 2012; Jin et al., 2015). In summary, there is a great uncertainty about the effects of ocean acidification on different species, ecosystems, and processes (Riebesell and Gattuso, 2015). It is very important to study its influence on biological processes and mechan- isms and to predict its influence.
Ocean acidification directly or indirectly induces changes of assimilation and dissimilation processes, affecting the production of POC and DOC and thus leading to changes of the CO2 absorption and organic carbon export by the oceans (Flynn et al., 2015). However, this hypothesis is very un- certain. Future studies need to be conducted, that is, ex- tensive scale-up experiments in different sea areas or regions, to obtain reliable quantitative indicators and reveal their processes and mechanisms and to integrate analysis and verify the effects of acidification on marine life and carbon sequestration.
3.9Implications of ancient marine research for mod- ern marine carbon sinks
For research on marine carbon sinks, a combination of an- cient and modern aspects is required. A blue carbon phe- nomenon occurred in Earth’s history. The Ediacaran Period (~635–541 Ma) witnessed the largest global carbon cycle perturbation in Earth’s history, that is, a persistent negative isotopic shift of global marine DIC that lasted for ?25–30 Ma, with a nadir of ?12‰ (i.e., “Shuram Excursion” event) (Grotzinger et al., 2011). This large negative carbon isotope excursion is considered to be the result of either full or partial oxidation of a superlarge DOC pool, which suspended in the Ediacaran oceans (Rothman et al., 2003; Fike et al., 2006; McFadden et al., 2008; Li C et al., 2017). Therefore, it has also become key evidence for the existence of a large DOCpool through carbon storage driven by the MCP in Ediacaran oceans (Jiao et al., 2013). However, this scenario was re- cently challenged by hypotheses about the oxidization of either aged organic carbon on land (Kaufman et al., 2007; Loyd et al., 2013; Osburn et al., 2015) or hydrocarbon-rich fluids released from the paleooceanic seafloor (Lee et al., 2015). However, the latest numerical simulation and eva- luation based on the carbon cycle mass balance principle suggested that the oxidation of these nondissolved organic carbon pools is limited by the availability of oxidants and/or organic carbon, leading to an oxygen level of <40% of the present atmospheric level (PAL) of the Ediacaran atmo- sphere, and was thus unable to sustain such a global carbon isotopic signal lower than ?12‰ for ?25–30 Ma, as observed for the “Shuram Excursion”. In contrast, the demands for terrestrial sulfate and marine DOC by partial oxidation of DOC are quantitatively feasible, while they can also explain the spatial heterogeneity of the Shuram event with respect to magnitude, duration, and temporal pattern (Shi W et al., 2017). The numerical evaluation quantitatively supports the existence of a large marine DOC reservoir in the Ediacaran and partial oxidation. Furthermore, it also provides evidence for strong carbon storage driven by the MCP under specific conditions. It was also reported that the crystal lattices of carbonates of the Doushantuo Formation in South China, which recorded the “Shuram Excursion”, captured some dissolved organic matter with special chemical structure, which was released during the oxidative degradation of this large DOC reservoir (Wang H et al., 2015), providing direct sedimentological evidence for the existence of a large DOC reservoir and intensive carbon storage due to the MCP in the Ediacaran oceans. A recent study on the spatial heterogeneity of the “Shuram Excursion” showed that the terrigenous weathering flux and marine redox heterogeneity are likely key factors that controlled the evolution of the marine MCP- DOC reservoir in the Ediacaran (Li C et al., 2017). All of these paleoceanographic studies are of great significance to elucidating mechanisms of modern marine carbon sinks and proposing effective ways for the increase of carbon sinks in modern oceans.
4.Conclusive remarks
Based on the comprehensive analysis of the carbon pools and fluxes in the Bohai Sea, Yellow Sea, East China Sea, and South China Sea, the key conclusions are summarized as below.
(1)The total carbon inventory of the China Seas is 167768.19 Tg C. In which, the total DIC pool is 164176.10 Tg C, with 36.95 Tg C in the Bohai Sea, 422.01 Tg C in the Yellow Sea , 844.50 Tg C in the East China Sea, and 162872.64 Tg C in the South China Sea. The total DOC poolof the China Seas is 3459.49 Tg C, with 4.51 Tg C in the Bohai Sea, 31.07 Tg C in the Yellow Sea, 33.57 Tg C in the East China Sea, and 3390.34 Tg C in the South China Sea. The total POC pool of the China Seas is 132.60 Tg C, with0.52 Tg C in the Bohai Sea, 7.22 Tg C in the Yellow Sea,6.91 Tg C in the East China Sea and 117.95 Tg C in the South China Sea.
(2)The overall biological carbon pool of the China seas is27.04 Tg C. In which, the total heterotrophic bacterial carbon pool is 14.00 Tg C, with 0.10 Tg C in the Bohai Sea, 0.39 Tg C in the Yellow Sea, 0.81 Tg C in the East China Sea and12.70 Tg C in the South China Sea). The total viral carbon pool is 1.99 Tg C, with 0.02, 0.02, 0.03, and 1.92 Tg C in the Bohai Sea, Yellow Sea, East China Sea, and South China Sea, respectively. The total phytoplankton carbon pool is
9.28 Tg C, with 0.36, 0.77, 2.02, and 6.13 Tg C in the Bohai Sea, Yellow Sea, East China Sea, and South China Sea re- spectively. The total zooplankton carbon pool is 1.77 Tg C, with 0.01, 0.46, 0.10, and 1.20 Tg C in the Bohai Sea, Yellow Sea, East China Sea, and South China Sea respectively.
(3)The net efflux of CO2 from the China seas is 6.01–9.33 Tg C yr?1. The CO2 released from the Bohai Sea is0.22 Tg C yr?1. The CO2 absorbed by the Yellow Sea and East China Sea is 1.15 and 6.92–23.30 Tg C yr?1, respec- tively. The efflux of CO2 from the South China Sea is 13.86–33.60 Tg C yr?1.
(4)The total riverine carbon input to the China Seas is 112.99–115.79 Tg C yr?1. The DIC input to the Bohai Sea and Yellow seas, East China Sea, and South China Sea are 5.04, 14.60, and 40.14 Tg C yr?1, respectively, and the cor- responding organic carbon inputs are 6.43, 5.72–8.52, and41.06 Tg C yr?1, respectively.
(5)The overall depositional flux of organic carbon in the China Seas is 20.49 Tg C yr?1. With 2.00, 3.60, 7.40, and7.49 Tg C yr?1 in the Bohai Sea, Yellow Sea, East China Sea, and South China Sea respectively.
(6)The net carbon flux to the China Seas from the adjacent oceans is 64.72–121.17 Tg C yr?1. The total inflow of DIC from adjacent oceans is 144.81 Tg C yr?1. The DIC input from the East China Sea to the Northwestern Pacific is35.00Tg C yr?1, while the DIC input from adjacent oceans to the South China Sea is 179.81 Tg C yr?1. The annual output of organic carbon from the China Seas is 58.64–80.09 Tg C yr?1, with 15.25–36.70 Tg C yr?1 from the East China Sea to the Northwestern Pacific and 43.93 Tg C yr?1 from the South China Sea to adjacent oceans. The output of organic carbon in marginal seas is dominated by DOC and the efflux is 46.39–66.39 Tg C yr?1, with 15.00–35.00 Tg C yr?1 from the East China Sea and 31.39 Tg C yr?1 from the South China Sea to adjacent oceans. The POC efflux from the China Seas is 12.25–13.70 Tg C yr?1, with 0.25–1.70 Tg C yr?1 from the East China Sea and 12.00 Tg C yr?1 from the South China Sea.
(7)If only sea-air interface exchange is considered, the China Seas appears as a source of atmospheric CO2, with a net efflux of 6.01–9.33 Tg C yr?1. This is mainly due to the input of DIC from rivers and adjacent oceans (59.78 and
144.81 Tg C yr?1, respectively). As a matter of fact, the China Seas is an important carbon sink as seen from the export of organic carbon to the sediment (18.92 Tg C yr?1) and to the adjacent oceans (58.64–80.09 Tg C yr?1).
(8)With respect to the major ecosystems, the mangrove carbon pool is 30.20 9.60 Tg C. The carbon depositional flux in mangroves, salt marshes, and seagrass beds is 0.09– 0.10, 0.26–1.64, and 0.01 Tg C yr?1, respectively. The flux ofCO released from coral reefs is 0.60–2.10 Tg C yr?1 and theto differences in the degree of research, coverage, in- vestigation time, season, and other aspects. The integrity and unity of all these factors limit the conclusions in this paper and highlight the uncertainties; for example, some of the data were depicted using interval representation and some are only numerical data and estimates. Therefore, it is necessary to further strengthen the study of the carbon storage and flux in the marginal seas off China with respect to temporal and spatial scales, sampling frequency, and process mechanisms to obtain a large amount of systematic data to improve our understanding.Acknowledgements This study is a contribution to the international2 ?1 IMBER project. This work was supported by the National Key Research andflux of calcified carbon is 2.60 Tg C yr . The depositional Development Program of China (Grant No. 2016YFA0601400), the Na-flux of organic carbon from coral reefs is 0.04 Tg C yr?1, the flux of organic carbon from coral reefs to adjacent oceans is0.19 Tg C yr?1, and the total carbon storage capacity is2.83 Tg C yr?1. The blue carbon depositional flux in the Chinese coastal zone is 0.36–1.75 Tg C yr?1. The DOC ef- flux of seagrass beds is up to 0.59 Tg C yr?1. The con- centration of removable carbon from macroalgae maricultures of China is 0.68 Tg C yr?1, while the fluxes of sedimentary organic carbon and DOC in this region are>0.14 and >0.82 Tg C yr?1, respectively. The carbon fixation flux of the entire marginal sea area is 854.76 Tg C yr?1; it is 8.66, 78.09, 222.99, and 545.06 Tg C yr?1 in the Bohai Sea, Yellow Sea, East China Sea, and South China Sea, respec- tively. The flux of new productivity in the China Seas is159.77 Tg C yr?1; it is 28.84 and 130.93 Tg C yr?1 in the East China Sea and South China Sea, respectively.
(9)Future directions in research and development of China Sea’s carbon sinks. For coastal blue carbon, restoration and reconstruction of the ecosystem is the main task. For mac- roalgae mariculture, artificial upwelling could be an effective measure to increase their sequestration potential. For es- tuarine and coastal areas, integration of land and sea is the right way to pursues enhancement of marine carbon se- questration and reduce the effects and severity of ecological disasters such as coastal eutrophication, red tides, hypoxia, and acidification. Finally, reducing the impact of human activities on the marine environment and mitigating the ef- fects of climate change on the ecosystems will reduce the pressure on them and help maintain sustainable development of coastal ecosystems.
Finally, we authors would like to point out that carbon budgets in the China Seas (Bohai Sea, Yellow Sea, East China Sea, and South China Sea) are not closed. The ex- change between different interfaces (land-sea, sea-air, sedi- ment-water, and marginal seas-oceans) is not directly comparable. Different ecosystems (e.g., mangroves, wet- lands, seagrass beds, seaweed farming, and coral reefs) have different values regarding the ecosystem service. Ad- ditionally, conclusions in the literature are not consistent duetional Natural Science Foundation of China (Grant Nos. 91751207, 91428308, 41722603, 41606153 and 41422603), the Fundamental Research Funds for the Central Universities (Grant No. 20720170107) and CNOOC Projects (Grant Nos. CNOOC-KJ125FZDXM00TJ001-2014 and CNOOC- KJ125FZDXM00ZJ001-2014).
References
Agusti S, Gonz lez-Gordillo J I, Vaqu D, Estrada M, Cerezo M I, Salazar G, Gasol J M, Duarte C M. 2015. Ubiquitous healthy diatoms in the deep sea confirm deep carbon injection by the biological pump. Nat Commun, 6: 7608
Aller R C, Blair N E. 2006. Carbon remineralization in the Amazon-Gui- anas tropical mobile mudbelt: A sedimentary incinerator. Cont Shelf Res, 26: 2241–2259
Arteaga L, Pahlow M, Oschlies A. 2016. Modeled Chl:C ratio and derived estimates of phytoplankton carbon biomass and its contribution to total particulate organic carbon in the global surface ocean. Glob Bio- geochem Cycle, 30: 1791–1810
Bai X G. 2007. Analysis of virioplankton abundance and correlation with picoplankton and heterotrophic bacteria in the Northern Yellow Sea (in Chinese). Master Dissertation. Qingdao: Ocean University of China
Battle M, Bender M L, Tans P P, White J W C, Ellis J T, Conway T, Francey R J. 2000. Global carbon sinks and their variability inferred from atmospheric O2 and 13C. Science, 287: 2467–2470
Bauer J E, Williams P M, Druffel E R M. 1992. 14C activity of dissolved organic carbon fractions in the north-central Pacific and Sargasso Sea. Nature, 357: 667–670
Berner R A. 1982. Burial of organic carbon and pyrite sulfur in the modern ocean; its geochemical and environmental significance. Am J Sci, 282: 451–473
Berner W H, Smetacek V, Wefer G. 1989. Production of the Ocean: Past and Present. Life Sciences Research Report 44. New York: Wiley. 471 Bunse C, Lundin D, Karlsson C M G, Akram N, Vila-Costa M, Palovaara J, Svensson L, Holmfeldt K, Gonz lez J M, Calvo E, Pelejero C, Marras
C, Dopson M, Gasol J M, Pinhassi J. 2016. Response of marine bac- terioplankton pH homeostasis gene expression to elevated CO2. Nat Clim Change, 6: 483–487
Burdige D J. 2005. Burial of terrestrial organic matter in marine sediments: A re-assessment. Glob Biogeochem Cycle, 19: GB4011
Cai L S, Fang J G, Liang X M. 2003. Natural sedimentation in large-scale aquaculture areas of Sungo Bay, north China Sea (in Chinese). J Fish Sci China, 10: 305–310
Cai P, Huang Y, Chen M, Guo L, Liu G, Qiu Y. 2002. New production based on 228Ra-derived nutrient budgets and thorium-estimated POC export at the intercalibration station in the South China Sea. Deep-Sea Res Part I-Oceanogr Res Pap, 49: 53–66
Cai P, Zhao D, Wang L, Huang B, Dai M. 2015. Role of particle stock and phytoplankton community structure in regulating particulate organic
carbon export in a large marginal sea. J Geophys Res-Oceans, 120: 2063–2095
Cai W J, Hu X, Huang W J, Murrell M C, Lehrter J C, Lohrenz S E, Chou W C, Zhai W, Hollibaugh J T, Wang Y, Zhao P, Guo X, Gundersen K, Dai M, Gong G C. 2011. Acidification of subsurface coastal waters enhanced by eutrophication. Nat Geosci, 4: 766–770
Cai Y M, Ning X R, Liu C G, Hao Q. 2007. Distribution pattern of pho- tosynthetic picoplankton and heterotrophic bacteria in the northern South China Sea. J Integr Plant Biol, 49: 282–298
Cao F J. 2017. Study on the bacterial production, the utilization of dis- solved organic carbon and the control factors in the South China Sea (in Chinese). Doctoral Dissertation. Xiamen: Xiamen University
Cao L, Song J, Li X, Yuan H, Li N, Duan L. 2013. Research progresses in carbon budget and carbon cycle of the coastal salt marshes in China (in Chinese). Acta Ecol Sin, 33: 5141–5152
Cao Z, Dai M, Zheng N, Wang D, Li Q, Zhai W, Meng F, Gan J. 2011. Dynamics of the carbonate system in a large continental shelf system under the influence of both a river plume and coastal upwelling. J Geophys Res, 116: G02010
Chai F, Liu G, Xue H, Shi L, Chao Y, Tseng C M, Chou W C, Liu K K. 2009. Seasonal and interannual variability of carbon cycle in South China Sea: A three-dimensional physical-biogeochemical modeling study. J Oceanogr, 65: 703–720
Chen B Z, Liu H B, Landry M R, Dai M H, Huang B Q, Sun J. 2009. Close coupling between phytoplankton growth and microzooplankton grazing in the western South China Sea. Limnol Oceanogr, 54: 1084–1097
Chen B, Liu H, Huang B. 2012. Environmental controlling mechanisms on bacterial abundance in the South China Sea inferred from generalized additive models (GAMs). J Sea Res, 72: 69–76
Chen C T A, Wang S L. 1998. Influence of intermediate water in the western Okinawa trough by the outflow from the South China Sea. J Geophys Res, 103: 12683–12688
Chen C T A, Wang S L, Chou W C, Sheu D D. 2006. Carbonate chemistry and projected future changes in pH and CaCO3 saturation state of the South China Sea. Mar Chem, 101: 277–305
Chen C T A, Lui H K, Hsieh C H, Yanagi T, Kosugi N, Ishii M, Gong G C. 2017. Deep oceans may acidify faster than anticipated due to global warming. Nat Clim Change, 7: 890–894
Chen G. 1956. Chinese coral reef (in Chinese). Geol China, 9: 16–19 Chen J, Zheng L, Wiesner M G, Chen R, Zheng Y, Wong H K. 1998.
Estimations of primary production and export production in the South China Sea based on sediment trap experiments. Chin Sci Bull, 43: 583– 586
Chen J M, Legendre L, Benner R. 2018. A recent project shows that the microbial carbon pump is a primary mechanism driving ocean carbon uptake. Natl Sci Rev, 5: 458
Chen M, Liu H, Song S, Sun J. 2015. Size-fractionated mesozooplankton biomass and grazing impact on phytoplankton in northern South China Sea during four seasons. Deep-Sea Res Part II-Top Stud Oceanogr, 117: 108–118
Chen W. 2008. On the export fluxes, seasonality and controls of particulate organic carbon in the Northern South China Sea (in Chinese). Doctoral Dissertation. Xiamen: Xiamen University
Chen X, Liu H, Weinbauer M, Chen B, Jiao N. 2011. Viral dynamics in the surface water of the western South China Sea in summer 2007. Aquat Microb Ecol, 63: 145–160
Chen Y H, Gao Y H, Chen C P, Liang J R, Sun L, Zhen Y, Qiao L. 2016. Seasonal variations of phytoplankton assemblages and its relation to environmental variables in a scallop culture sea area of Bohai Bay, China. Mar Pollut Bull, 113: 362–370
Chen Y L L. 2005. Spatial and seasonal variations of nitrate-based new production and primary production in the South China Sea. Deep-Sea Res Part I-Oceanogr Res Pap, 52: 319–340
Chou W C, Gong G C, Hung C C, Wu Y H. 2013. Carbonate mineral saturation states in the East China Sea: Present conditions and future scenarios. Biogeosciences, 10: 6453–6467
Chou W C, Gong G C, Sheu D D, Hung C C, Tseng T F. 2009. Surface
distributions of carbon chemistry parameters in the East China Sea in summer 2007. J Geophys Res, 114: C07026
Chou W C, Sheu D D, Chen C T A, Wen L S, Yang Y, Wei C L. 2007a. Transport of the South China Sea subsurface water outflow and its influence on carbon chemistry of Kuroshio waters off southeastern Taiwan. J Geophys Res, 112: C12008
Chou W C, Sheu D D, Lee B S, Tseng C M, Chen C T A, Wang S L, Wong G T F. 2007b. Depth distributions of alkalinity, TCO2 and at SEATS time-series site in the northern South China Sea. Deep-Sea Res Part II- Top Stud Oceanogr, 54: 1469–1485
Chou W C, Sheu D D D, Chen A C T, Wang S L, Tseng C M. 2005. Seasonal variability of carbon chemistry at the SEATS time-series site, northern South China Sea between 2002 and 2003. Terr Atmos Ocean Sci, 16: 445–465
Coppola A I, Wiedemeier D B, Galy V, Haghipour N, Hanke U M, Nas- cimento G S, Usman M, Blattmann T M, Reisser M, Freymond C V, Zhao M, Voss B, Wacker L, Schefu? E, Peucker-Ehrenbrink B, Abiven S, Schmidt M W I, Eglinton T I. 2018. Global-scale evidence for the refractory nature of riverine black carbon. Nat Geosci, 11: 584–588
Dai M, Meng F, Tang T, Kao S J, Lin J, Chen J, Huang-Chuan J, Tian J, Gan J, Yang S. 2009a. Excess total organic carbon in the intermediate water of the South China Sea and its export to the North Pacific. Geochem Geophys Geosyst, 10: Q12002
Dai M H, Lu Z M, Zhai W D, Chen B S, Cao Z M, Zhou K B, Cai W J, Chen C T A. 2009b. Diurnal variations of surface seawater pCO2 in contrasting coastal environments. Limnol Oceanogr, 54: 735–745
Dai M, Cao Z, Guo X, Zhai W, Liu Z, Yin Z, Xu Y, Gan J, Hu J, Du C. 2013. Why are some marginal seas sources of atmospheric CO2? Geophys Res Lett, 40: 2154–2158
Deng B, Zhang J, Wu Y. 2006. Recent sediment accumulation and carbon burial in the East China Sea. Glob Biogeochem Cycle, 20: GB3014-480 DeVries T. 2014. The oceanic anthropogenic CO2 sink: Storage, air-sea fluxes, and transports over the industrial era. Glob Biogeochem Cycle,
28: 631–647
DeVries T, Holzer M, Primeau F. 2017. Recent increase in oceanic carbon uptake driven by weaker upper-ocean overturning. Nature, 542: 215– 218
Fabricius K E, Langdon C, Uthicke S, Humphrey C, Noonan S, de’Ath G, Okazaki R, Muehllehner N, Glas M S, Lough J M. 2011. Losers and winners in coral reefs acclimatized to elevated carbon dioxide con- centrations. Nat Clim Change, 1: 165–169
FAO. 2016. The State of World Fisheries and Aquaculture 2016. Con- tributing to food security and nutrition for all. Rome: Food and Agri- culture Organization. 200
Fike D A, Grotzinger J P, Pratt L M, Summons R E. 2006. Oxidation of the Ediacaran Ocean. Nature, 444: 744–747
Fisheries Administration Bureau of Ministry of Agriculture. 2017. China Fishery Statistics Yearbook (in Chinese). Beijing: China Agriculture Press
Flynn K J, Clark D R, Mitra A, Fabian H, Hansen P J, Glibert P M, Wheeler G L, Stoecker D K, Blackford J C, Brownlee C. 2015. Ocean acidification with (de)eutrophication will alter future phytoplankton growth and succession. Proc R Soc B-Biol Sci, 282: 20142604
Fu M Z, Sun P, Wang Z L, Li Y, Li R X. 2009. Size structure and potential export of phytoplankton primary production in the southern Huanghai (Yellow) Sea (in Chinese). Acta Oceanol Sin, 31: 100–109
Fu M Z, Sun P, Wang Z L, Li Y, Li R X. 2010. Seasonal variations of phytoplankton community size structures in the Huanghai (Yellow) Sea Cold Water Mass area (in Chinese). Acta Oceanol Sin, 32: 120–129
Galy V, France-Lanord C, Beyssac O, Faure P, Kudrass H, Palhol F. 2007. Efficient organic carbon burial in the Bengal fan sustained by the Hi- malayan erosional system. Nature, 450: 407–410
Gan S, Wu Y, Zhang J. 2016. Bioavailability of dissolved organic carbon linked with the regional carbon cycle in the East China Sea. Deep-Sea Res Part II-Top Stud Oceanogr, 124: 19–28
Gao K S, Xu J T, Gao G, Li Y H, Hutchins D A, Huang B Q, Wang L, Zheng Y, Jin P, Cai X, H?der D P, Li W, Xu K, Liu N, Riebesell U.
2012. Rising CO2 and increased light exposure synergistically reduce marine primary productivity. Nat Clim Change, 2: 519–523
Gao S. 2009. Spatial and seasonal variation of Chlorophyll and primary productivity and their controlling factors in the Northern Yellow Sea (in Chinese). Doctoral Dissertation. Qingdao: Ocean University of China
Gao X L, Song J M, Li X G, Li N, Yuan H M. 2009. Distribution char- acteristics of dissolved inorganic carbon in southern Yellow Sea in autumn (in Chinese). Mar Environ Scie, 28: 17–21
Garbelli C, Angiolini L, Shen S. 2017. Biomineralization and global change: A new perspective for understanding the end-Permian extinc- tion. Geology, 45: 19–22
Gattuso J P, Magnan A, Bill R, Cheung W W L, Howes E L, Joos F, Allemand D, Bopp L, Cooley S R, Eakin C M, Hoegh-Guldberg O, Kelly R P, P?rtner H O, Rogers A D, Baxter J M, Laffoley D, Osborn D, Rankovic A, Rochette J, Sumaila U R, Treyer S, Turley C. 2015. Contrasting futures for ocean and society from different anthropogenic CO2 emissions scenarios. Science, 349: 4722
Giering S L C, Sanders R, Lampitt R S, Anderson T R, Tamburini C, Boutrif M, Zubkov M V, Marsay C M, Henson S A, Saw K, Cook K, Mayor D J. 2014. Reconciliation of the carbon budget in the ocean’s twilight zone. Nature, 507: 480–483
Gong G C, Wen Y H, Wang B W, Liu G J. 2003. Seasonal variation of chlorophyll a concentration, primary production and environmental conditions in the subtropical East China Sea. Deep-Sea Res Part II-Top Stud Oceanogr, 50: 1219–1236
Grotzinger J P, Fike D A, Fischer W W. 2011. Enigmatic origin of the largest-known carbon isotope excursion in Earth’s history. Nat Geosci, 4: 285–292
Guo S, Li Y, Zhang C, Zhai W, Huang T, Wang L. 2014. Phytoplankton community in the Bohai Seaand its relationship with environmental factors (in Chinese). Mar Sci Bull, 33: 95–105
Guo X H, Zhai W D, Dai M H, Zhang C, Bai Y, Xu Y, Li Q, Wang G Z. 2015. Air-sea CO2 fluxes in the East China Sea based on multiple-year underway observations. Biogeosciences, 12: 5495–5514
H?nisch B, Ridgwell A, Schmidt D N, Thomas E, Gibbs S J, Sluijs A, Zeebe R, Kump L, Martindale R C, Greene S E, Kiessling W, Ries J, Zachos J C, Royer D L, Barker S, Marchitto T M, Moyer R, Pelejero C, Ziveri P, Foster G L, Williams B. 2012. The geological record of ocean acidification. Science, 335: 1058–1063
Han Y, Lin H. 1997. Carbon flux research in the South China Sea (in Chinese). Acta Oceanol Sin, 19: 50–54
Hansell D A, Carlson C A, Schlitzer R. 2012. Net removal of major marine dissolved organic carbon fractions in the subsurface ocean. Glob Bio- geochem Cycle, 26: GB1016-9
Hansell D A, Carlson C A. 2001. Biogeochemistry of total organic carbon and nitrogen in the Sargasso Sea: Control by convective overturn. Deep- Sea Res Part II-Top Stud Oceanogr, 48: 1649–1667
Hansell D A, Carlson C A, Repeta D J, Schlitzer R. 2009. Dissolved organic matter in the ocean: A controversy stimulates new insights. Oceanography, 22: 202–211
He L, Yin K, Yuan X, Li D, Zhang D, Harrison P. 2009. Spatial distribution of viruses, bacteria and chlorophyll in the northern South China Sea. Aquat Microb Ecol, 54: 153–162
Hedges J I, Keil R G. 1995. Sedimentary organic matter preservation: An assessment and speculative synthesis. Mar Chem, 49: 81–115
Ho T Y, You C F, Chou W C, Pai S C, Wen L S, Sheu D D. 2009. Cadmium and phosphorus cycling in the water column of the South China Sea: The roles of biotic and abiotic particles. Mar Chem, 115: 125–133
Holm n K. 2000. The global carbon cycle. Inter Geophys, 72: 282–321 Hong H S, Dai M H. 1994. Biogeochemical studies of biologically im-
portant elements in the Taiwan Strait. In: Zhou D, Liang Y, Zeng C, Tseng CK, eds. Oceanology of China Seas, vol. V1. Dordrecht: Kluwer Academic Publishers. 201–212
Hu L, Shi X, Guo Z, Wang H, Yang Z. 2013. Sources, dispersal and preservation of sedimentary organic matter in the Yellow Sea: The importance of depositional hydrodynamic forcing. Mar Geol, 335: 52– 63
Hu L, Shi X, Bai Y, Qiao S, Li L, Yu Y, Yang G, Ma D, Guo Z. 2016. Recent organic carbon sequestration in the shelf sediments of the Bohai Sea and Yellow Sea, China. J Mar Syst, 155: 50–58
Huang R, Sun F. 1994. Impacts of the thermal state and the convective activities in the tropical western warm pool on the summer climate anomalies in East Asia (in Chinese). Sci Atmos Sin, 18: 141–151
Huang T H, Chen C T A, Tseng H C, Lou J Y, Wang S L, Yang L, Kandasamy S, Gao X, Wang J T, Aldrian E, Jacinto G S, Anshari G Z, Sompongchaiyakul P, Wang B J. 2017. Riverine carbon fluxes to the South China Sea. J Geophys Res-Biogeo, 122: 1239–1259
Hung J J, Wang S M, Chen Y L. 2007. Biogeochemical controls on dis- tributions and fluxes of dissolved and particulate organic carbon in the Northern South China Sea. Deep-Sea Res Part II-Top Stud Oceanogr, 54: 1486–1503
IGBP, IOC, SCOR. 2013. Ocean acidification summary for policymakers— Third symposium on the ocean in a high-CO2 world. International Geosphere-Biosphere Programme, Stockholm
Ji H, Sheng G, Xin H, Sha Y. 2009. Distribution of dissolved inorganic carbon (DIC) and its related parameters in seawater of the North Yellow Sea and off the Qingdao Coast in October, 2007. J Ocean Univ China, 8: 366–376
Ji J, Wang P. 2015. Research on China’s mariculture carbon sink capacity and influencing factors (in Chinese). Mar Environ Sci, 34: 871–878
Jiang Q. 2010. Study on the macro-zooplankton and meso-zooplankton community ecology in the North Yellow Sea in spring and autumn (in Chinese). Doctoral Dissertation. Qingdao: Ocean University of China
Jiang Z, Liu S, Zhang J, Zhao C, Wu Y, Yu S, Zhang X, Huang C, Huang X, Kumar M. 2017. Newly discovered seagrass beds and their potential for blue carbon in the coastal seas of Hainan Island, South China Sea. Mar Pollut Bull, 125: 513–521
Jiao N, Wang R, Li C. 1998. Primary production and new production in spring in the East China Sea (in Chinese). Oceanol Limnol Sin, 29: 135–140
Jiao N, Yang Y, Koshikawa H, Watanabe M. 2002. Influence of hydro- graphic conditions on picoplankton distribution in the East China Sea. Aquat Microb Ecol, 30: 37–48
Jiao N Z, Yang Y H. 2002. Ecological studies on Prochlorococcus in China seas. Chin Sci Bull, 47: 1243–1250
Jiao N, Yang Y, Hong N, Ma Y, Harada S, Koshikawa H, Watanabe M. 2005. Dynamics of autotrophic picoplankton and heterotrophic bacteria in the East China Sea. Cont Shelf Res, 25: 1265–1279
Jiao N, Zhao Y, Luo T, Wang X. 2006. Natural and anthropogenic forcing on the dynamics of virioplankton in the Yangtze river estuary. J Mar Biol Ass, 86: 543–550
Jiao N, Herndl G J, Hansell D A, Benner R, Kattner G, Wilhelm S W, Kirchman D L, Weinbauer M G, Luo T, Chen F, Azam F. 2010. Mi- crobial production of recalcitrant dissolved organic matter: Long-term carbon storage in the global ocean. Nat Rev Microbiol, 8: 593–599
Jiao N Z, Zhang C L, Li C, Wang X X, Dang H Y, Zeng Q L, Zhang Y, Zhang R, Tang K, Zhang Z L, Xu D P. 2013. Controlling mechanisms and climate effects of microbial carbon pump in the ocean (in Chinese). Sci Sin Terr, 43: 1–18
Jiao N, Robinson C, Azam F, Thomas H, Baltar F, Dang H, Hardman- Mountford N J, Johnson M, Kirchman D L, Koch B P, Legendre L, Li C, Liu J, Luo T, Luo Y W, Mitra A, Romanou A, Tang K, Wang X, Zhang C, Zhang R. 2014a. Mechanisms of microbial carbon seques- tration in the ocean-future research directions. Biogeosciences, 11: 5285–5306
Jiao N, Zhang Y, Zhou K, Li Q, Dai M, Liu J, Guo J, Huang B. 2014b. Revisiting the CO2 “source” problem in upwelling areas—A com- parative study on eddy upwellings in the South China Sea. Bio- geosciences, 11: 2465–2475
Jiao N, Wang H, Xu G, Aric S. 2018a. Blue carbon on the rise: Challenges and opportunities. Natl Sci Rev, 5: 464–468
Jiao N, Cai R, Zheng Q, Tang K, Liu J, Jiao F, Wallace D, Chen F, Li C, Amann R, Benner R, Azam F. 2018b. Unveiling the enigma of re- fractory carbon in the ocean. Natl Sci Rev, 5: 459–463
Jiao N, Tang K, Cai H, Mao Y. 2011. Increasing the microbial carbon sink in the sea by reducing chemical fertilization on the land. Nat Rev Mi- crobiol, 9: 75
Jin H, Lin Y, Chen J, Jin M. 2005. Analysis of driving factors and dis- tribution of particulate organic carbon in the Huanghai Sea and the East China Sea (in Chinese). Acta Oceanol Sin, 27: 46–53
Jin P, Wang T F, Liu N N, Dupont S, Beardall J, Boyd P W, Riebesell U, Gao K S. 2015. Ocean acidification increases the accumulation of toxic phenolic compounds across trophic levels. Nat Commun, 6: 8714
Kaufman A J, Corsetti F A, Varni M A. 2007. The effect of rising atmo- spheric oxygen on carbon and sulfur isotope anomalies in the Neo- proterozoic Johnnie Formation, Death Valley, USA. Chem Geol, 237: 47–63
Keil R. 2017. Anthropogenic forcing of carbonate and organic carbon preservation in marine sediments. Annu Rev Mar Sci, 9: 151–172
Kong B, Chen H. Yuan Y. 2016. Analysis of current structure and seasonal cariation at PN Section of the East China Sea Kuroshio during 1991– 2011 (in Chinese). Acta Oceanol Sin, 38: 14–26
Krause-Jensen D, Duarte C M. 2016. Substantial role of macroalgae in marine carbon sequestration. Nat Geosci, 9: 737–742
Laffoley D, Grimsditch G. 2009. The Management of Natural Coastal Carbon Sinks. Gland: IUCN
Le F, Ning X, Liu C, Hao Q, Shi J. 2010. Community structure of pico- plankton abundance and biomass in the southern Huanghai Sea during the spring and autumn of 2006. Acta Oceanol Sin, 29: 58–68
Lee C, Love G D, Fischer W W, Grotzinger J P, Halverson G P. 2015. Marine organic matter cycling during the Ediacaran Shuram excursion. Geology, 43: 1103–1106
Lee S, Fuhrman J A. 1987. Relationships between biovolume and biomass of naturally derived marine bacterioplankton. Appl Environ Microbiol, 53: 1298–1303
Legendre L, Rivkin R B, Weinbauer M G, Guidi L, Uitz J. 2015. The microbial carbon pump concept: Potential biogeochemical significance in the globally changing ocean. Prog Oceanogr, 134: 432–450
Le Qu r C, Andrew R M, Canadell J G, Sitch S, Korsbakken J I, Peters G
P. 2016. Global Carbon Budget 2016. Earth Syst Sci Data, 8: 605–649 Li C, Hardisty D S, Luo G, Huang J, Algeo T J, Cheng M, Shi W, An Z, Tong J, Xie S, Jiao N, Lyons T W. 2017. Uncovering the spatial het-
erogeneity of Ediacaran carbon cycling. Geobiology, 15: 211–224
Li F T, Wu Y P, Hutchins D A, Fu F X, Gao K S. 2016. Physiological responses of coastal and oceanic diatoms to diurnal fluctuations in seawater carbonate chemistry under two CO2 concentrations. Bio- geosciences, 13: 6247–6259
Li H, Wiesner M G, Chen J, Ling Z, Zhang J, Ran L. 2017. Long-term variation of mesopelagic biogenic flux in the central South China Sea: Impact of monsoonal seasonality and mesoscale eddy. Deep-Sea Res Part I-Oceanogr Res Pap, 126: 62–72
Li J, Hu B Q, Dou Y G, Zhao J T, Li G G. 2012. Modern sedimentation rate, budget and supply of the muddy deposits in the East China Seas. Geol Rev, 58: 745–756
Li J, Jiang X, Li G, Jing Z, Zhou L, Ke Z, Tan Y. 2017. Distribution of picoplankton in the northeastern South China Sea with special reference to the effects of the Kuroshio intrusion and the associated mesoscale eddies. Sci Total Environ, 589: 1–10
Li N, Wang J. 2011. Dissolved inorganic and organic carbon in the North of East China Sea (ECS) coastal waters in spring (in Chinese). Mar Sci, 35: 5–10
Li W, Gao K. 2012. A marine secondary producer respires and feeds more in a high CO2 ocean. Mar Pollut Bull, 64: 699–703
Li W, Wang Y, Wang J, Wei H. 2012. Distributions of water masses and hydrographic structures in the Yellow Sea and East China Sea in spring and summer 2011 (in Chinese). Oceanol Limnol Sin, 43: 615–623
Li X. 2017. Research on temporal and spatial distribution and influence factors of NPP in Bohai Sea based on MODIS data from 2003 to 2015 (in Chinese). Doctoral Dissertation. Shijiazhuang: Hebei Normal Uni- versity
Liang Y. 2014. Large-scale Distributions of the Marine Virioplankton and
Picoplankton in the Epipelagic Zone and Deep Oceans (in Chinese). Doctoral Dissertation. Xiamen: Xiamen University
Liang Y, Li L, Luo T, Zhang Y, Zhang R, Jiao N. 2014. Horizontal and vertical distribution of marine virioplankton: A basin scale investigation based on a global cruise. Plos One, 9: e111634
Liang Y, Zhang Y, Wang N, Luo T, Zhang Y, Rivkin R B. 2017. Esti- mating primary production of picophytoplankton using the carbon- based ocean productivity model: a preliminary study. Front Microbiol, 8: 1926
Liu J, Jiao N, Tang K. 2014. An experimental study on the effects of nutrient enrichment on organic carbon persistence in the western Pacific oligotrophic gyre. Biogeosciences, 11: 5115–5122
Liu J, Yu Z, Zang J, Sun T, Zhao C, Ran X. 2015. Distribution and budget of organic carbon in the Bohai and Yellow Seas (in Chinese). Adv Earth Sci, 30: 564–578
Liu J P, Milliman J D, Gao S, Cheng P. 2004. Holocene development of the Yellow River’s subaqueous delta, North Yellow Sea. Mar Geol, 209: 45–67
Liu J P, Xu K H, Li A C, Milliman J D, Velozzi D M, Xiao S B, Yang Z S. 2007. Flux and fate of Yangtze River sediment delivered to the East China Sea. Geomorphology, 85: 208–224
Liu H, Chang J, Tseng C M, Wen L S, Liu K K. 2007. Seasonal variability of picoplankton in the Northern South China Sea at the SEATS station. Deep-Sea Res Part II-Top Stud Oceanogr, 54: 1602–1616
Liu H, Ren H, Hui D, Wang W, Liao B, Cao Q. 2014. Carbon stocks and potential carbon storage in the mangrove forests of China. J Environ Manage, 133: 86–93
Liu H K, Chen C T A, Lee J, Wang S L, Gong G C, Bai Y, He X. 2015. Acidifying intermediate water accelerates the acidification of seawater on shelves: An example of the East China Sea. Cont Shelf Res, 111: 223–233
Liu K K, Chao S Y, Shaw P T, Gong G C, Chen C C, Tang T Y. 2002. Monsoon-forced chlorophyll distribution and primary production in the South China Sea: Observations and a numerical study. Deep-Sea Res Part I-Oceanogr Res Pap, 49: 1387–1412
Liu K K, Chen Y J, Tseng C M, Lin I I, Liu H B, Snidvongs A. 2007. The significance of phytoplankton photo-adaptation and benthic-pelagic coupling to primary production in the South China Sea: Observations and numerical investigations. Deep-Sea Res Part II-Top Stud Oceanogr, 54: 1546–1574
Liu Q, Dai M, Chen W, Huh C A, Wang G, Li Q, Charette M A. 2012. How significant is submarine groundwater discharge and its associated dis- solved inorganic carbon in a river-dominated shelf system? Bio- geosciences, 9: 1777–1795
Liu Q, Guo X, Yin Z, Zhou K, Roberts E G, Dai M. 2018. Carbon fluxes in the China Seas: An overview and perspective. Science China Earth Sciences, 61, https://doi.org/10.1007/s11430-017-9267-4
Liu T L. 2001. Distribution of dissolved and particulate organic carbon, nitrogen and phosphorus in the South China Sea and the Taiwan Strait (in Chinese with English abstract). Master Dissertation. Taipei: Taiwan Sun Yan-Sen University
Liu X, Fan J, Wang Z. 2013. The seasonal changes of phytoplankton community in North Yellow Sea, China (in Chinese). Ecol Environ Sci, 22: 1173–1181
Liu W, Wang R, Ji P. 1997. Study on particulate organic carbon in the East China Sea (in Chinese). Oceanol Limnol Sin, 28: 39–43
Longhurst A R, Harrison G W. 1989. The biological pump: Profiles of plankton production and consumption in the upper ocean. Prog Ocea- nogr, 22: 47–123
Loyd S J, Marenco P J, Hagadorn J W, Lyons T W, Kaufman A J, Sour- Tovar F, Corsetti F A. 2013. Local 34S variability in ~580 Ma carbo- nates of northwestern Mexico and the Neoproterozoic marine sulfate reservoir. Precambrian Res, 224: 551–569
Lu L, Wang M, Liang Y, Wang F, Yang L, Wang J, Wang H, Wang J. 2013. Distribution of virioplankton, heterotrophic bacteria in the Yellow Sea and East China Sea (in Chinese). Oceanol Limnol Sin, 44: 1339–1346
Lu X, Song J, Yuan H, Li N. 2015. Carbon Distribution and Exchange of
Kuroshio and Adjacent China Sea Shelf: A Review (in Chinese). Adv Earth Sci, 30: 214–225
Lu X. 2015. Carbon exchange between Kuroshio and East China Sea. Doctoral Dissertation. Beijing: University of Chinese Academy of Sciences
Lv R. 2003. Primary production. Zheng Y, Chen X, Cheng J. Biological Resources and Environment in the East China Sea Shelf. Shanghai: Shanghai Science and Technology Press. 116–136
Ma W, Sun J. 2014. Characteristics of phytoplankton community in the northern South China Sea in summer and winter (in Chinese). Acta Ecol Sin, 34: 621–632
McFadden K A, Huang J, Chu X, Jiang G, Kaufman A J, Zhou C, Yuan X, Xiao S. 2008. Pulsed oxidation and biological evolution in the Edia- caran Doushantuo Formation. Proc Natl Acad Sci USA, 105: 3197– 3202
Mcleod E, Chmura G L, Bouillon S, Salm R, Bj?rk M, Duarte C M, Lovelock C E, Schlesinger W H, Silliman B R. 2011. A blueprint for blue carbon: Toward an improved understanding of the role of vegetated coastal habitats in sequestering CO2. Front Ecol Environ, 9: 552–560
McKee B A, Aller R C, Allison M A, Bianchi T S, Kineke G C. 2004. Transport and transformation of dissolved and particulate materials on continental margins influenced by major rivers: Benthic boundary layer and seabed processes. Cont Shelf Res, 24: 899–926
Mei X Y, Zhang X. 2008. Carbon storage and fixation by a typical wetland vegetation in Changjiang River Estuary—A case study of Phragmites australis in east beach of Chongming Island (in Chinese). Chin J Eco- Agriculture, 16: 269–272
Meng F, Dai M, Cao Z, Wu K, Zhao X, Li X, Chen J, Gan J. 2017. Seasonal dynamics of dissolved organic carbon under complex circu- lation schemes on a large continental shelf: The Northern South China Sea. J Geophys Res-Oceans, 122: 9415–9428
Nellemann C, Corcoran E. 2009. Blue carbon: The role of healthy oceans in binding carbon: A rapid response assessment. In: Nellemann C, Cor- coran E, Duarte C M, Vald s L, De Young C, Fonseca L, Grims-ditch G, eds. UNEP/Earthprint
Ning X, Chai F, Xue H, Cai Y, Liu C, Shi J. 2004. Physical-biological oceanographic coupling influencing phytoplankton and primary pro- duction in the South China Sea. J Geophys Res, 109: C10005
Osburn M R, Owens J, Bergmann K D, Lyons T W, Grotzinger J P. 2015. Dynamic changes in sulfate sulfur isotopes preceding the Ediacaran Shuram Excursion. Geochim Cosmochim Acta, 170: 204–224
Polimene L, Sailley S, Clark D, Mitra A, Allen J I. 2016. Biological or microbial carbon pump? The role of phytoplankton stoichiometry in ocean carbon sequestration. J Plankton Res, 39: 180–186
Polimene L, Rivkin R B, Luo Y W, Kwon E Y, Gehlen M, Pe?a M A, Wang N, Liang Y, Kaartokallio H, Jiao N. 2018. Modelling marine DOC degradation time scales. Natl Sci Rev, 5: 468–474
Qiao L, Wang Z, Liu S, Li G, Liu X, Huang L, Xue W, Zhong Y. 2017. From continental shelf seas to the western Pacific: the path and me- chanism of cross-shelf suspended sediment transport in the Yellow Sea and East China Sea (in Chinese). Earth Sci Front, 24: 134–140
Qiao S, Shi X, Wang G, Zhou L, Hu B, Hu L, Yang G, Liu Y, Yao Z, Liu S. 2017. Sediment accumulation and budget in the Bohai Sea, Yellow Sea and East China Sea. Mar Geol, 390: 270–281
Qin Y Z, Hao Y, Chen L, Zhao S. 1989. Geology of the Yellow Sea (in Chinese). Beijing: Science Publishing House. 200
Qiu G L, Lin X Z, Li Z S, Fan H Q, Zhou H L, Liu G H. 2014. Seagrass ecosystems: Contributions to and mechanisms of carbon sequestration (in Chinese). Chin J Appl Ecol, 25:1825–1832
Qu B X, Song J M, Li X G, YuanH M, Li N, Ma Q X. 2013a. pCO2
distribution and CO2 flux on the inner continental shelf of the East China Sea during summer 2011. Chin J Ocean Limnol, 31: 1088–1097 Qu B X, Song J M, Yuan, H M, Li X G, Li N, Duan L Q, Ma Q X, Chen X. 2013b. Advances of seasonal variations and controlling factors of the
air-sea CO2 flux in the East China Sea. Adv Earth Sci, 28: 783–793 Qu B X, Song J M, YuanH M, Li X G, Li N. 2014. Air-sea CO2 exchange
process in the southern Yellow Sea in April of 2011, and June, July,
October of 2012. Cont Shelf Res, 80: 8–19
Qu B X, Song J M, YuanH M, Li X G, Li N, Duan L Q, Chen X L X. 2015. Summer carbonate chemistry dynamics in the Southern Yellow Sea and the East China Sea: Regional variations and controls. Cont Shelf Res, 111: 250–261
Qu B X, Song J M, YuanH M, Li X G, Li N, Duan L Q. 2017. Comparison of carbonate parameters and air-sea CO2 flux in the southern Yellow Sea and East China Sea during spring and summer of 2011. J Oceanogr, 73: 365–382
Ran L, Lu X X, Sun H, Han J, Li R, Zhang J. 2013. Spatial and seasonal variability of organic carbon transport in the Yellow River, China. J Hydrol, 498: 76–88
Ran L, Chen J, Wiesner M G, Ling Z, Lahajnar N, Yang Z, Li H, Hao Q, Wang K. 2015. Variability in the abundance and species composition of diatoms in sinking particles in the northern South China Sea: Results from time-series moored sediment traps. Deep-Sea Res Part II-Top Stud Oceanogr, 122: 15–24
Reinthaler T, van Aken H M, Herndl G J. 2010. Major contribution of autotrophy to microbial carbon cycling in the deep North Atlantic’s interior. Deep-Sea Res Part II-Top Stud Oceanogr, 57: 1572–1580
Riebesell U, Gattuso J P. 2015. Lessons learned from ocean acidification research. Nat Clim Change, 5: 12–14
Robinson C, Wallace D, Hyun J H, Polimene L, Benner R, Zhang Y, Cai R, Zhang R, Jiao N. 2018. An implementation strategy to quantify the marine microbial carbon pump and its sensitivity to global change. Natl Sci Rev, 5: 474–480
Rothman D H, Hayes J M, Summons R E. 2003. Dynamics of the Neo- proterozoic carbon cycle. Proc Natl Acad Sci USA, 100: 8124–8129
Sabine C L, Feely R A, Gruber N, Key R M, Lee K, Bullister J L, Wan- ninkhof R, Wong C S, Wallace D W R, Tilbrook B, Millero F J, Peng T H, Kozyr A, Ono T, Rios A F. 2004. The oceanic sink for anthropogenic CO2. Science, 305: 367–371
Shang R. 2011. The distribution and influence factors of organic carbon in the Bohai Sea and Yellow Sea of 2010 (in Chinese). Doctoral Dis- sertation. Qingdao: Ocean University of China
Shi F, Cui L, Jiang H, Shen Y. 2017. Numerical Analysis of the Effects of Seasonal Variation on Distributions and Influences of Surface Chlor- ophyll-a in the Yellow Sea and the Bohai Sea (in Chinese). J Basic Sci Eng, 25: 700–711
Shi Q, Zhao M X, Zhang Q M, Yu K F, Chen T R, Li S, Wang H K. 2009. Estimate of carbonate production by scleractinian corals at Luhuitou fringing reef, Sanya, China. Chin Sci Bull, 54: 696–705
Shi W, Li C, Algeo T J. 2017. Quantitative model evaluation of organic carbon oxidation hypotheses for the Ediacaran Shuram carbon isotopic excursion. Sci China Earth Sci, 60: 2118–2127
Smith S V. 1978. Coral-reef area and the contributions of reefs to processes and resources of the world’s oceans. Nature, 273: 225–226
Song J. 2004. Biogeochemistry in Chinese Offshore (in Chinese). Shan- dong: Shandong Science and Technology Press
Song J. 2011. Carbon cycling processes and carbon fixed by organisms in China marginal seas (in Chinese). J Fish Sci China, 18: 703–711
Song J, Xu Y, Zhang Y, Li X, Yuan H. 2006. Progress of marine biogeo- chemical processes in China (in Chinese). Mar Sci, 30: 69–77
Song J, Qu B, Li X, Yuan H, Li N, Duan L. 2018. Carbon sinks/sources in the Yellow and East China Seas–Air-sea interface exchange, dissolution in seawater, and burial in sediments. Sci China Earth Sci, 61, https://doi. org/10.1007/s11430-017-9213-6
State Oceanic Administration of China. 2013. Bulletin of Marine En- vironmental Status of China in 2012 (in Chinese). 77
Su S, Chen B, Huang B. 2014. Species composition and the grazing of microzooplankton in the Yellow Sea and East China Sea in spring and summer of 2011 (in Chinese). J Appl Oceanogr, 33: 60–67
Stone R. 2010. The invisible hand behind a vast carbon reservoir. Science, 328: 1476–1477
Sun J, Liu D. 2003. Geometric models for calculating cell biovolume and surface area for phytoplankton. J Plankton Res, 25: 1331–1346
Sun Z. 2001. Model calculation of the particulate organic carbon flux in the
East China Sea (in Chinese). Doctoral Dissertation. Qingdao: Institute of Oceanology, Chinese Academy of Sciences
Suo A, Zhao D, Zhang F. 2010. Carbon storage and fixation by wetland vegetation at the estuaries in northern China: A case of Panjin area, Liaohe Delta (in Chinese). J Mar Sci, 28: 67–71
Suttle C A. 2005. Viruses in the sea. Nature, 437: 356–361
Tang B, Long J, Zhang W, Xie Y, Qiao J, Zhai W. 2014. A review on the carbon sequestration capacity of coastal wetlands and its research progress in China (in Chinese). Mar Sci Bull, 33: 481–490
Tang J, Ye S, Chen X, Yang H, Sun X, Wang F, Wen Q, Chen S. 2018. Coastal blue carbon: Concept, study method, and the application to ecological restoration. Sci China Earth Sci, 61: 637–646
Tang Q S, Chen C T A, Yu K F, Dai M H, Zhao M X, Ke C H, Wong G T F, Chai F, Wei G J, Zhou L P, Chen L Q, Song J K, Barry J, Wu Y P, Gao K S. 2013. The effects of ocean acidification on marine organisms and ecosystem (in Chinese). Chin Sci Bull, 58: 1307–1314
Tang Q S, Liu H. 2016. Strategy for Carbon Sink and Its Amplification in Marine Fisheries (in Chinese). Eng Sci, 18: 68–73
Tao S, Eglinton T I, Montlu?on D B, McIntyre C, Zhao M. 2016. Diverse origins and pre-depositional histories of organic matter in contemporary Chinese marginal sea sediments. Geochim Cosmochim Acta, 191: 70– 88
Tao S, Eglinton T I, Zhang L, Yi Z, Montlu?on D B, McIntyre C, Yu M, Zhao M. 2018. Temporal variability in composition and fluxes of Yel- low River particulate organic matter. Limnol Oceanogr, 63: S119–S141 Tseng C M, Wong G T F, Lin I I, Wu C R, Liu K K. 2005. A unique seasonal pattern in phytoplankton biomass in low-latitude waters in the
South China Sea. Geophys Res Lett, 32: L08608
Tseng C M, Wong G T F, Chou W C, Lee B S, Sheu D D, Liu K K. 2007. Temporal variations in the carbonate system in the upper layer at the SEATS station. Deep-Sea Res Part II-Top Stud Oceanogr, 54: 1448– 1468
Tseng C M, Shen P Y, Liu K K. 2014. Synthesis of observed air-sea CO2 exchange fluxes in the river-dominated East China Sea and improved estimates of annual and seasonal net mean fluxes. Biogeosciences, 11: 3855–3870
Tsunogai S, Watanabe S, Sato T. 1999. Is there a “continental shelf pump” for the absorption of atmospheric CO2 ? Tellus B-Chem Phys Meteorol, 51: 701–712
Vivani D A. 2016. Variability and controls of production, partitioning, and utilization of organic matter in the north pacific subtropical gyre (in Chinese). Doctoral Dissertation. Hawaii: Univeristy of Hawaii
Volk T, Hoffert M I. 1985. Ocean carbon pumps: Analysis of relative strength and efficiencies of in ocean-driven circulation atmospheric CO2 changes. In: Sundquist E T, Broecker W S, eds. The Carbon Cycle and Atmospheric CO2: Natural Variation Archean to Present. AGU Mono- graph 32. American Geophysical Union, Washington D C. 99–110
Wang C, Wang Y, Paterson J S, Mitchell J G, Hu X, Zhang H, Sheng Y. 2016. Macroscale distribution of virioplankton and heterotrophic bac- teria in the Bohai Sea. Fems Microbiol Ecol, 92: fiw017
Wang G Z, Jing W P, Wang S L, Xu Y, Wang Z Y, Zhang Z L, Li Q L, Dai M H. 2014. Coastal acidification induced by tidal-driven submarine groundwater discharge in a coastal coral reef system. Environ Sci Technol, 48: 13069–13075
Wang H, Li C, Hu C, Xie S. 2015. Spurious thermoluminescence char- acteristics of the Ediacaran Doushantuo Formation (ca. 635–551 Ma) and its implications for marine dissolved organic carbon reservoir. J Earth Sci, 26: 883–892
Wang G, Wang Z, Zhai W, Moore W S, Li Q, Yan X, Qi D, Jiang Y. 2015. Net subterranean estuarine export fluxes of dissolved inorganic C, N, P, Si, and total alkalinity into the Jiulong River estuary, China. Geochim Cosmochim Acta, 149: 103–114
Wang J, Wang M, Liu Z, Liu D, Yang L, Lu L, Wang Y, Sun H. 2013. The spatial and temporal distribution of virioplankton in the Bohai Sea (in Chinese). Oceanol Limnol Sin, 44: 1597–1603
Wang J, Xiao X, Zhou Q, Xu X, Zhang C, Liu J, Yuan D. 2018. Rates and fluxes of centennial-scale carbon storage in the fine-grained sediments
from the central South Yellow Sea and Min-Zhe belt, East China Sea. J Ocean Limnol, 36: 139–152
Wang L. 2011a. Zooplankton community structure in the South Yellow Sea in winter and indication of the Yellow Sea Warm Current (in Chinese). Doctoral Dissertation. Qingdao: Institute of Oceanology, Chinese Academy of Sciences
Wang L. 2011b. New Production in the East China Sea and Northern South China Sea (in Chinese). Doctoral Dissertation. Xiamen: Xiamen Uni- versity
Wang S, Guan Y, Li Z, Chao Y, Huang J. 2015. Variable characteristics of the wintertime net heat flux along the Kuroshio system and its asso- ciation with climate in China. Int J Climatol, 35: 1180–1191
Wang X, Luo C, Ge T, Xu C, Xue Y. 2016. Controls on the sources and cycling of dissolved inorganic carbon in the Changjiang and Huanghe River estuaries, China: 14C and 13C studies. Limnol Oceanogr, 61: 1358–1374
Wang X, Ma H, Li R, Song Z, Wu J. 2012. Seasonal fluxes and source variation of organic carbon transported by two major Chinese Rivers: The Yellow River and Changjiang (Yangtze) River. Global Biogeochem Cycles, 26: GB2025
Wang X J, Zhang H B, Han G X. 2016. Carbon Cycle and “Blue Carbon” Potential in China’s Coastal Zone (in Chinese). Bull Chin Acad Sci, 31: 1218–1225
Wang Y, Zhang R, Zheng Q, Deng Y, Van Nostrand J D, Zhou J, Jiao N. 2015. Bacterioplankton community resilience to ocean acidification: Evidence from microbial network analysis. ICES J Mar Sci, 73: 865– 875
Wei C L, Lin S Y, Sheu D D D, Chou W C, Yi M C, Santschi P H, Wen L
S. 2011. Particle-reactive radionuclides (234Th, 210Pb, 210Po) as tracers for the estimation of export production in the South China Sea. Bio- geosciences, 8: 3793–3808
Wei H, Tian T, Zhou F, Zhao L. 2002. Numerical Study on the Water Exchange of the Bohai Sea: Simulation of the Half-Life Time by Dis- persion Model (in Chinese). J Ocean Univ Qingdao, 32: 519–525
Wiebe P H, Boyd S, Cox J L. 1975. Relationships between zooplankton displacement volume, wet weight, dry weight, and carbon. Fish Bull, 73: 777–786
Wong G T F, Ku T L, Mulholland M, Tseng C M, Wang D P. 2007. The SouthEast Asian Time-series Study (SEATS) and the biogeochemistry of the South China Sea—An overview. Deep-Sea Res Part II-Top Stud Oceanogr, 54: 1434–1447
Wu K, Dai M, Chen J, Meng F, Li X, Liu Z, Du C, Gan J. 2015. Dissolved organic carbon in the South China Sea and its exchange with the Western Pacific Ocean. Deep-Sea Res Part II-Top Stud Oceanogr, 122: 41–51
Wu K, Dai M, Li X, Meng F, Chen J, Lin J. 2017. Dynamics and pro- duction of dissolved organic carbon in a large continental shelf system under the influence of both river plume and coastal upwelling. Limnol Oceanogr, 62: 973–988
Wu Y, Zhang J, Li D J, Wei H, Lu R X. 2003. Isotope variability of particulate organic matter at the PN section in the East China Sea. Biogeochemistry, 65: 31–49
Xia B, Zhang L. 2011. Carbon distribution and fluxes of 16 rivers dis- charging into the Bohai Sea in summer. Acta Oceanol Sin, 30: 43–54
Xia B, Cui Y, Chen B, Cui Z, Qu K, Ma F. 2014. Carbon and nitrogen isotopes analysis and sources of organic matter in surface sediments from the Sanggou Bay and its adjacent areas, China. Acta Oceanol Sin, 33: 48–57
Xie Y Y, Huang B Q, Lin L Z, Laws E A, Wang L, Shang S L, Zhang T L, Dai M H. 2015. Photosynthetic parameters in the northern South China Sea in relation to phytoplankton community structure. J Geophys Res- Oceans, 120: 4187–4204
Xing L, Zhao M, Gao W, Wang F, Zhang H, Li L, Liu J, Liu Y. 2014. Multiple proxy estimates of source and spatial variation in organic matter in surface sediments from the southern yellow sea. Org Geo- chem, 76: 72–81
Xu D, Sun X, Chen B, Xia B, Cui Z, Zhao J et al. 2016. The EcologicalCharacteristics of Zooplankton in the Central Bohai Sea (in Chinese). Progr Fish Sci, 37: 7–18
Xu Z, Chao M, Chen Y. 2004. Distribution characteristics of zooplankton biomass in the East China Sea (in Chinese). Acta Oceanol Sin, 26: 93– 101
Xue B, Sun J, Li T. 2016. Phytoplankton community structure of northern South China Sea in summer of 2014 (in Chinese). Acta Oceanol Sin, 38: 54–65
Xue L. 2011. Surface CO2 in the Yellow Sea and buoy CO2 in the South Atlantic Bight (in Chinese). Doctoral Dissertation. Qingdao: Ocean University of China
Xue L, Xue M, Zhang L, Sun T, Guo Z, Wang J. 2012. Surface partial pressure of CO2 and air-sea exchange in the northern Yellow Sea. J Mar Syst, 105-108: 194–206
Xue L, Zhang L, Cai W J, Jiang L Q. 2011. Air-sea CO2 fluxes in the southern Yellow Sea: An examination of the continental shelf pump hypothesis. Cont Shelf Res, 31: 1904–1914
Yan H Q, Yu K F, Tan Y H. 2009. Recent development in the research of carbon cycle in coral reef exosystem (in Chinese). Acta Oceanol Sin, 29: 6207–6215
Yan H Q, Yu K F, Shi Q, Tan Y H, Zhang H L, Zhao M X, Li S, Chen T R, Huang L Y, Wang P X. 2011. Coral reef ecosystems in the South China Sea as a source of atmospheric CO2 in summer. Chin Sci Bull, 56: 676– 684
Yan H, Yu K, Shi Q, Tan Y, Liu G, Zhao M, Li S, Chen T, Wang Y. 2016. Seasonal variations of seawater pCO2 and sea-air CO2 fluxes in a fringing coral reef, northern South China Sea. J Geophys Res-Oceans, 121: 998–1008
Yang W F, Huang Y P, Chen M, Qiu Y S, Peng A G, Zhang L. 2009. Export and remineralization of POM in the Southern Ocean and the South China Sea estimated from 210Po/210Pb disequilibria. Chin Sci Bull, 54: 2118–2123
Yang Y. 2000. Dynamics of picophytoplankton in the East and South China Seas and some priliminary in situ experiments on nutrient enrichment effects (in Chinese). Doctoral Dissertation. Qingdao: Institute of Oceanology, Chinese Academy of Sciences
Yang Y, Han X, Masashi K. 2004. POC fluxes from euphotic zone esti- mated from 234Th deficiency in winter in the northwestern North Pacific Ocean. Acta Oceanol Sin, 23: 135–147
Yang Y, Sun X. 2016. Seasonal variations of net phytoplankton in carbon biomass and community structure in the South Yellow Sea (in Chinese). Oceanol Limnol Sin, 47: 954–962
Yasunaka S, Nojiri Y, Nakaoka S, Ono T, Mukai H, Usui N. 2013. Monthly maps of sea surface dissolved inorganic carbon in the North Pacific: Basin-wide distribution and seasonal variation. J Geophys Res-Oceans, 118: 3843–3850
Yin W H, Qi Y P, Cao Z M, Zhang Y C, Tang H X. 2012. The environ- mental characteristics of the major greenhouse gases and seawater pCO2 in the Bohai Sea (in Chinese). Tran Oceanol Limnol, 4: 189–193
Yu K F. 2012. Coral reefs in the South China Sea: Their response to and records on past environmental changes. Sci China Earth Sci, 55: 1217– 1229
Yu K, Zhao J. 2009. Coral reefs. In: Wang P X, Li Q Y, eds. Paleocea- nography and Sedimentology. Berlin: Springer-Verlag. 229–243
Yuan D, Hsueh Y. 2010. Dynamics of the cross-shelf circulation in the Yellow and East China Seas in winter. Deep-Sea Res Part II-Top Stud Oceanogr, 57: 1745–1761
Yuan D, He J, Li J, He L. 2018. Cross-shelf carbon transport under different greenhouse gas emission scenarios in the East China Sea during winter. Sci China Earth Sci, 61: 659–667, https://doi.org/10.1007/s11430-017- 9164-9
Yuan M L, Sun J, Zhai W D. 2014. Phytoplamkton community in Bohai Sea and the North Yellow Sea in Autumn 2012 (in Chinese). J Tianjin Univ Tech, 27: 56–64
Zhai W D, Zhao H D, Zheng N, Xu Y. 2012. Coastal acidification in summer bottom oxygen-deplented water in northwestern-northern Bo- hai Sea from June to August in 2011 (in Chinese). Chin Sci Bull, 57:
753–758
Zhai W D, Dai M H, Chen B S, Guo X H, Li Q, Shang S L, Zhang C Y, Cai W J, Wang D X. 2013. Seasonal variations of sea-air CO2 fluxes in the largest tropical marginal sea (South China Sea) based on multiple-year underway measurements. Biogeosciences, 10: 7775–7791
Zhai W D, Zheng N, Huo C, Xu Y, Zhao H D, Li Y W, Zang K P, Wang J Y, Xu X M. 2014. Subsurface pH and carbonate saturation state of aragonite on the Chinese side of the North Yellow Sea: Seasonal var- iations and controls. Biogeosciences, 11: 1103–1123
Zhang C, Dang H, Azam F, Benner R, Legendre L, Passow U, Polimene L, Robinson C, Suttle C A, Jiao N. 2018. Evolving paradigms in biological carbon cycling in the ocean. Natl Sci Rev, 5: 481–499
Zhang L, Guo Z H, Li Z Y. 2013. Carbon storage and carbon sink of mangrove wetland: Research progress (in Chinese). Chin J Appl Ecol, 24: 1153–1159
Zhang L, Xue L, Song M, Jiang C. 2010. Distribution of the surface partial pressure of CO2 in the southern Yellow Sea and its controls. Cont Shelf Res, 30: 293–304
Zhang N X, Sun X, Cao C H, Ren R X, Tao H H, Sun B. 2012. Distribution characteristics and source/sink changes of dissolved inorganic carbon around the Bohai in winter (in Chinese). Acta Oceanol Sin, 34: 94–101 Zhang X L, Zhang C H, Xu Z J, Hou X J, Cai Q F. 2012. On the relation between carbon storage and reinforced fixation of the coastal wetland vegetation in the Yellow River delta area (in Chinese). J Safety Environ,
12: 145–149
Zhang X S, Zhang L J. 2007. Phenomena of pH instant increasing and its effect on dissolved inorganic carbon flux to sea in Yellow River estuary (in Chinese). Environ Sci, 28: 1216–1222
Zhang Y. 2008. The carbon flux and mataining mechanism of pCO2 in the Bohai Sea in Summer (in Chinese). Doctoral Dissertation. Qingdao: Ocean University of China
Zhang Y, Jiao N, Hong N. 2008. Comparative study of picoplankton bio- mass and community structure in different provinces from subarctic to subtropical oceans. Deep-Sea Res Part II-Top Stud Oceanogr, 55: 1605– 1614
Zhang Y, Zhao M X, Cui Q, Fan W, Qi J G, Chen Y, Zhang Y Y, Gao K S, Fan J F, Wang G Y, Yan C L, Lu H L, Luo Y W, Zhang Z L, Zheng Q, Xiao W, Jiao N Z. 2017. Processes of coastal ecosystem carbon se- questration and approaches for increasing carbon sink. Sci China Earth Sci, 60: 809–820
Zhang Y Y, Zhang J H, Liang Y T, Li H M, Li G, Chen X, Zhao P, Jiang Z J, Zou D H, Liu X Y, Liu J H. 2017. Carbon sequestration processes and mechanisms in coastal mariculture environments in China. Sci China Earth Sci, 60: 2097–2107
Zhang Y R, Ding Y P, Li T J, Xue B, Guo Y M. 2016. Annual variations of chlorphyll a and primary productivity in the East China Sea (in Chi- nese). Oceanol Limnol Sin, 47: 261–268
Zhang Z, Gong X L, Hu Y, Zhang L B, Chen H G, Huang H H, Cai W G. 2016. Abundance of bacterioplankton and virioplankton in the central and northern South China Sea in autumn (in Chinese). South China Fish Sci,12: 9–16
Zhang Z, Wang X H, Gong X L, Liu Y, Liao X L, Cai W G, Huang H H. 2017. Ecological distribution of bacterioplankton and virioplankton in the north of South China Sea in spring (in Chinese). Acta Ecol Sin, 37: 1639–1649
Zhao H D, Kao S J, Zhai W D, Zang K P, Zheng N, Xu X M, Huo C, Wang J Y. 2017. Effects of stratification, organic matter remineralization and bathymetry on summertime oxygen distribution in the Bohai Sea, China. Cont Shelf Res, 134: 15–25
Zhao J S, Ji H W, Guo Z G. 2003. The vertical distribution of particulate organic carbon in the typical areas of the East China Sea in winter (in Chinese). Mar Sci, 27: 59–63
Zhao M X, Ding Y, Yu M. 2017. Sources of sedimentary organic matter in China Marginal Sea surface sediments and implications of carbon sink (in Chinese). Period Ocean Univ China, 47: 70–76
Zhao Q B, Sun J, Li D, Xuan J l. 2015. Seasonal changes of the phyto- plankton along hypoxia area and adjacent waters in the East China Sea(in Chinese). Acta Ecol Sin, 35: 2366–2379 Zhao S, Xiao T, Lu R, Lin Y. 2010. Spatial variability in biomass and production of heterotrophic bacteria in the East China Sea and the Yellow Sea. Deep-Sea Res Part II-Top Stud Oceanogr, 57: 1071–1078 Zhao Y. 2010. Spatial and temporal distribution of picoplankton in Yellow Sea and East China Sea (in Chinese). Doctoral Dissertation. Qingdao: Graduate School of Chinese Academy of Sciences (Institute of Ocea-
nology)
Zheng F Y, Qiu G L, Fan H Q, Zhang W. 2013. Diversity, distribution and conservation of Chinese seagrass species (in Chinese). Biod Sci, 21: 517–526
Zheng G X, Song J M, Dai J C, Wang Y M. 2006. Distributions of chlorophyll-a and carbon fixed strength of phytoplanktonin autumn of the southern Huanghai Seawaters (in Chinese). Acta Oceanol Sin, 28:
109–118
Zhou C H, Mao Q Y, Xu X, Fang C M, Lu Y M, Li B. 2016. Preliminary Analysis of C Sequestration Potential of Blue Carbon Ecosystemson Chinese Coastal Zone (in Chinese). Sci Sin Vitae, 46: 475–486
Zhou W, Liao J, Guo Y, Yuan X, Huang H, Yuan T, Liu S. 2017. High dark carbon fixation in the tropical South China Sea. Cont Shelf Res, 146: 82–88
Zhou Y, Zhang X M, Xu S C, Song X Y, Lin H Y, Wang P M, Gu R T. 2016. New discovery of larger seagrass beds with areas >50 ha intemperate waters of China: An unusual large seagrass (Zostera japonica) bed in the Yellow River estuary (in Chinese). Mar Sci, 40: 95–97
Zhu Y Z. 2008. Study on the Macro-zooplankton and Meso-zooplankton community ecology in North Yellow Sea in summer and winter (in Chinese). Doctoral Dissertation. Qingdao: Ocean University of China
(Responsible editor: Chuanlun ZHANG)