

Cross-shelf carbon transport under different greenhouse gas emission scenarios in the East China Sea during winter
Dongliang YUAN1'2'3*, Jiajia HAO1'2, Jianle LI4,5 & Lei HE4,5
1Key Laboratory of Ocean Circulation and Waves, Institute of Oceanology, Chinese Academy of Sciences, Qingdao 266071, China;
2Functional Laboratory of Ocean dynamics and climate variability, Qingdao National Laboratory for Marine Science and Technology,
Qingdao 266237, China;
3University of Chinese Academy of Sciences, Beijing 100049, China;
4School of Marine Sciences, Sun Yat-Sen University, Guangzhou 510006, China;
5Guangdong Provincial Key Laboratory of Marine Resources and Coastal Engineering, Guangzhou 510006, China
Received October 19, 2017; revised November 14, 2017; accepted January 3, 2018; published online March 15, 2018
Abstract Based on Marx-Planck coupled model simulations and in situ hydrography measurements, the volume transport of ocean currents and associated carbon fluxes across the continental margin from the continental shelf to the deep ocean in the East China Sea during winter are estimated. Because cross-shelf currents in the Yellow and East China seas are much stronger in winter than in other seasons and are subducted into the subsurface Kuroshio, the cross-shelf burial of carbon takes place mainly in winter. The analyses show prominent cross-shelf transports during winter in the Yellow and East China seas, with annual mean offshore transport across a section from Taiwan to Cheju at 3.92 Sv (1 Sv=106 m3 s 1). Net transport across the section was 0.82 Sv off the shelf, determined by the difference between Taiwan and Cheju strait transports. Net cross-shelf transports of dissolving inorganic carbon (DIC), dissolved organic carbon (DOC), and particulate organic carbon (POC) in winter were 98, 12, and 0.1 million tons, respectively. Under global greenhouse gas emission reduction (RCP4.5) and continuous increase (RCP8.5) scenarios, this cross-shelf transport has an increasing trend. The transports across the Taiwan-Cheju section in winter are predicted to increase by 0.54 and 0.65 Sv from 2006 to 2099, with rates of increase 15.3% and 19.6%, respectively. Associated with the transport increase, the cross-shelf fluxes of DIC, DOC and POC increase by as much as 15.4-25.2%. Cross-shelf carbon fluxes in the East China Sea during winter are evaluated for the first time under the global warming scenarios, showing the importance of cross-shelf transport in the carbon cycle of the China marginal seas.
Keywords Cross-shelf transport, Carbon fluxes, Global warming, RCP8.5, RCP4.5
Citation: Yuan D L, Hao J J, Li J L, He L. 2018. Cross-shelf carbon transport under different greenhouse gas emission scenarios in the East China Sea during winter. Science China Earth Sciences, 61: 659-667, https://doi.org/10.1007/s11430-017-9164-9
1.Introduction
As one of the largest marginal seas in the world, the East China Sea (ECS) is forced by the strongest monsoon systems in the world, the East Asian monsoon, and one of the strongest currents in the world oceans, the Kuroshio. The ECS receives effluents from a river with one of the largestCorresponding author (email: dyuan@qdio.ac.cn)
runoffs in the world, the Changjiang, and sediments from one of the most turbid rivers in the world, the Yellow River. As a result, the ECS has a very complicated circulation system and prominent ecosystem phenomena. It is one of the key areas of material transport from the Asian continent to the western Pacific Ocean. The basin-scale, cross-shelf circulation in the Yellow and East China seas (YECS), its exchange with the Kuroshio, and the dynamics and fluxes of the exchange, all are very important to global ocean material andenergy balances and regional environmental variations.
Because of sovereignty convenience for observations, the western Yellow and East China seas have been traditional research areas for Chinese ocean scientists since the founding of the People's Republic of China. Studies have focused on individual branches of the shelf circulation, owing to limitations of historical data and economic conditions. The study of full-scale exchange between the YECS and Kur- oshio has been inadequate (Nitani, 1972; Beardsley et al., 1985; Hu, 1994; Guan, 1994; Su, 1998; Lin et al., 2001). Lately, with the advent of multiple parameters of satellite remote sensing data, some prominent oceanographic phenomena have been disclosed and uncovered in the YECS, an example of which is the cross-shelf circulation system in those seas (Yuan et al., 2008). That study shows that coastal waters in the southwestern Yellow sea are carried by crossshelf movement of the Subei coastal current to the area of the Kuroshio. This cross-shelf current path is obvious in satellite ocean color and sea surface temperature (SST) images, and has also been identified in historical observational data. Offshore movement of the Yellow Sea Coastal Current was called the East China Sea Current by Yuan and Hsueh (2010). Counter to the cross-shelf movement of that current is the onshore movement of the Yellow Sea Warm Current and the Taiwan Warm Current against the wind in winter. This carries outer shelf waters to nearshore areas, forming the large- scale sea water exchange system in the YECS. The turbidity plume from the old Huanghe mouth in winter has been reported in previous studies (Milliman et al., 1985), but the cross-shelf circulation system underlying the phenomenon has been less addressed.
In winter, the temperature of the ECS is much lower than that of the Kuroshio surface water. The cross-shelf movement of the East China Sea Current subducts the high-density shelf waters into the Kuroshio subsurface below about 100-200 m (Tsunogai et al., 1999), which then enter the global ocean circulation via the Kuroshio. Associated with the subduction of the East China Sea Current, a large amount of dissolving inorganic carbon (DIC), dissolved organic carbon (DOC), and particulate organic carbon (POC) are transported to the Kuroshio subsurface, which will only return to the sea surface in ~100 years (Munk, 1966). Therefore, this type of cross-shelf subduction represents carbon sink to the deep ocean. We call it the cross-shelf carbon burial process.
Carbon transport across the continental shelf to the deep sea represent the ability of the continental marginal sea to bury terrestrial particle carbon and atmospheric carbon dioxide, which is an important scientific problem of global carbon cycle to be resolved. The subject has become a popular new research topic in recent years. Dai et al. (2009) and Wu et al. (2015) used observations of total organic carbon (TOC) from 2009 to 2011 to estimate seasonal carbon flux through the Luzon Strait. They revealed a carbon flux from the South China Sea to the North Pacific in the middle layer of the Luzon Strait. Xiao et al. (2015) and Qiao et al. (2016) combined numerical simulations with observational data to calculate fluxes of suspended sediments across sections in the eastern China seas in winter and summer. Zhou et al. (2015) estimated water exchange flux across 100-m isobaths using numerical simulations. Zhang et al. (2017) analyzed offshore flux and its seasonal variation across the 50-m and 100-m isobaths, also based on numerical simulations. These studies focused on the cross-shelf transport and its variation. There has been a lack of estimation of carbon flux associated with the transport. That requires in situ observations of carbon concentrations in the water, including DIC, DOC, and POC. Supported by the National Basic Research Program project “Responses of the Ocean to Global Warming and Their Impact on East Asian Monsoon and Marginal Sea Carbon Storage", the Institute of Oceanology of the Chinese Academy of Sciences surveyed material fluxes in the YECS during January 2005. Multiple parameters of the ocean environment were observed during the cruise, providing the prerequisite for estimating the carbon fluxes across the continental margin to the deep ocean.
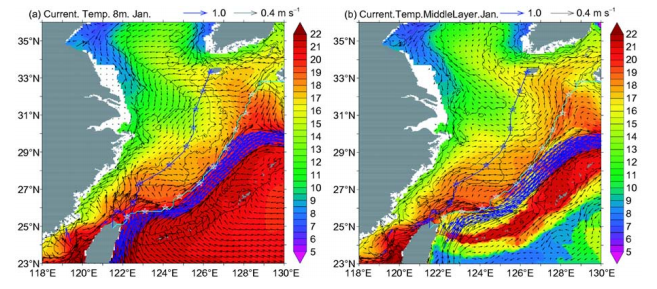
Figure 1 Multiyear (2006-2016, RCP4.5) average circulation and temperature at surface and middle layer in January (blue arrows denote velocity > 0.4 m s-1).
Studies have suggested that the cross-shelf transport has three main pathways (Yuan and Hsueh, 2010; Qiao et al., 2017), i.e., transport by the East China Sea Current to southwest of Cheju, by cross-shelf penetrating fronts off the Min-Zhe coasts, and cross-shelf movement of the eastwardflowing branch of the Taiwan Warm Current. This paper focuses on estimating winter carbon flux across the Taiwan- Cheju section (TWCJ) (Figure 1) from the continental shelf to the deep ocean. Carbon flux subduction into the deep ocean and its trends in the ECS in winter are estimated based on a combination of observational data with numerical simulations, yielding estimates of potential carbon burial in the China marginal seas.
2.Data and method
2.1Model descriptions
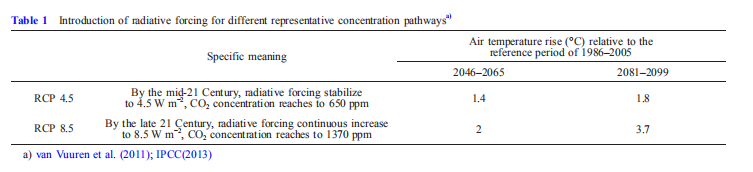
The simulations were performed with the Max-Planck Institute Ocean Model. It is formulated on a tripolar grid with orthogonal curvilinear C-grids and Z-coordinates. The grid has a horizontal resolution of~0.1 . In the vertical, the model has 40 levels, with a 10-m interval in the first 100 m. The ocean model was driven by outputs of the atmospheric model ECHAM5 under two greenhouse-gas representative concentration pathways (RCP), namely, the reduction (RCP4.5) and continuous increase (RCP8.5) scenarios (Table 1). As a result, the ocean model reflects the RCP4.5 and RCP8.5 scenarios through wind-forcing circulation variations. Detailed information on the model simulations are in Aldrian et al. (2005). The outputs are monthly means (2006-2099), and the multiyear average circulation and volume transports show that the simulation captured the YECS circulation characteristics well (Figures 1 and 2).
In April 2016, more than 170 countries adopted the “Paris Agreement" on climate change, with goals controlling global air temperature rise to a range of 2 C, with an ideal target of 1.5 C. As shown in Table 1, global air temperature rises 1.4 and 2 C in the mid-21st Century under the radiative forcing of RCP4.5 and RCP8.5, respectively. Therefore, estimates of cross-shelf carbon transport into the deep ocean and its trends in the China marginal seas under various greenhouse gas emission scenarios will provide scientific evidence for carbon emission negotiation in the future.
2.2Observations
Considering that cross-shelf carbon flux from the continental shelf to the deep ocean in the ECS mainly occurs in winter (Yuan et al., 2008), the Institute of Oceanology of the Chinese Academy of Sciences carried out a survey of material fluxes in the YECS from December 29, 2014, to January 27, 2015, supported by the National Basic Research Program project “Responses of the Ocean to Global Warming and Their Impact on East Asian Monsoon and Marginal Sea Carbon Storage". There were 89 stations investigated, including an intensive observational section along the shelf break in the ECS (Figure 2). Water samples were collected throughout the water column, at depths 3, 10, 20, 30, 50, 75 and 100 m, and the bottom.
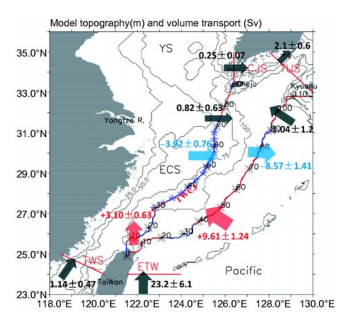
Figure 2 Model topography (isobaths) and annual mean (2006-2016) volume transport across section TWCJ, 200-m isobaths and other major straits, and their standard deviations (Sv; red numbers, arrows and lines denote onshore flux, with blue ones representing offshore and black ones net flux; pentagrams denote observations and asterisks every ten model grid points along isobaths). Section TWCJ: closed section from Taiwan to Cheju; YS: Yellow Sea; ECS: East China Sea; CJS: Cheju Strait; TUS: Tsushima Strait; TWS: Taiwan Strait; ETW: Kuroshio of eastern Taiwan.
Sampling and measurement of DIC, DOC and POC followed Joint Global Ocean Flux Study protocols (Knap et al., 1996). Pre-weighed 47-mm diameter filters (0.45-pm pore size) were used to collect total suspended matter (TSM).
laboratory. DIC samples were preserved with HgCl2 and measured with a DIC analyzer (Li-7000, Apollo SciTech Inc., USA). DOC samples were obtained by filtration of water samples through pre-combusted 0.7-pm GF/F filters and collected in 40-mL pre-combusted brown glass vials. Samples were frozen immediately at -20 C until analysis. Concentrations of DOC were determined using high-temperature catalytic oxidation techniques and a Shimadzu TOC analyzer. For POC samples, seawater was filtered through pre-combusted 0.7-pm GF/F filters. The filters were ana-lyzed by combustion with an elemental analyzer (Vario EL cube CHNS/O, Elementar, Germany).
The observations and simulated ocean currents were used to estimate carbon transport across the TWCJ section into the deep ocean. Figure 2 shows that observations were absent northeast of Taiwan Island and southwest of Cheju Island in the survey. Therefore, we combined data of this survey with previous observations near those two regions (Hung et al., 2000; Cheng et al., 2012; Shang et al., 2012; Bian et al., 2013; Lu etal., 2015) (Table 2). Combined dataofthe TWCJ section are shown in Figure 3.
2.3Methods
First, simulated velocity data on original orthogonal curvilinear C-grids were averaged at temperature grid points. Then, these data were converted to a right-handed orthogonal coordinate. The converted simulated data were selected along the TWCJ section and 200-m isobaths according to model topography (Figure 2). At last, the data along the isobaths were decomposed normal to the isobaths.
Inflow volume transport (IVT) and outflow volume transport (OVT) were calculated via
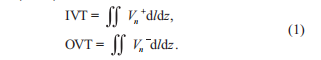
where, Vn is the velocity component normal to the isobaths, and + and - represent inward to the coast and outward to the deep ocean, respectively. dl is the grid-point interval along the isobaths, and dz is the grid-point interval in the vertical. Net flux is the sum of IVT and OVT.
Because the major process of the “continental shelf pump" (Tsunogai et al., 1999) occurs in winter (December-February), cross-shelf carbon transport in that season was used to represent the main carbon transport of the entire year. The observations were linearly interpolated on model grids along the TWCJ section, referred to as C. Carbon flux is the product of the volume flux and carbon concentration (C): JJ V.Cdldz.
3.Results and discussion
3.1 Multiyear average circulation and volume transport
Figure 1 shows the multiyear (2006-2016) mean RCP4.5 simulated circulation and temperature at the surface and middle layer (representing the inner geostrophic current away from the upper and lower Ekman layers, respectively) in January. The model reproduced well the large-scale, crossshelf water exchange system in the YECS. Coastal waters in the southwestern Yellow sea are carried by cross-shelf movement of the Subei coastal current to the area of the Kuroshio. Counter to the cross-shelf movement of the East China Sea Current is the onshore movement of the Yellow Sea Warm Current and Taiwan Warm Current against the wind in winter, which transports the outer shelf waters to nearshore areas. On the continental shelfs shallower than 75 m, there is mainly an onshore Ekman current at the surface that is driven by northeasterly winds in winter, with a mainly offshore geostrophic current in the middle layer.
The annual mean (2006-2016, RCP4.5) cross-shelf volume transport is shown in Figure 2. It reveals that such transport across the TWCJ, 200-m isobaths, and other major straits matches well with previous observations (Isobe, 2008) and model results (Zhou et al., 2015; Zhang et al., 2017). This indicates the ability of the model to maintain water balance and evaluate cross-shelf carbon transport. Annual mean fluxes across the TWCJ and 200-m isobaths have clearly varying features. Annual mean offshore transport across the TWCJ into the deep ocean was 3.92 Sv (1 Sv= 106 m3 s-1). The net transport was 0.82 Sv (offshore), including flux (northward) across the Taiwan Strait (1.14 Sv) and flux (eastward) across the Cheju Strait (0.25 Sv). However, the net transport flux across the 200-m isobaths was onshore, about 1.04 Sv. This onshore net transport converged with the offshore net flux across the TWCJ and the eastward flux across the Cheju Strait between the 100-m and 200-m isobaths. They constitute the net flux across Tsushima Strait (2.1 Sv). Because the onshore and offshore fluxes are larger than the net flux by one order magnitude, estimation of offshore and onshore transport is helpful to understand the transport of terrestrial material to the deep ocean. The transport across section TWCJ to the shelf sea was ~3.1 Sv, which was mainly at the shelf breaks northeast of Taiwan and southwest of Cheju Island. However, the offshore transport was 3.92 Sv, which was largely at the middle of the shelf. The intrusion across the 200-m isobaths to the coastal sea was also mainly at the shelf break northeast of Taiwan.
3.2 Cross-shelf carbon transport in winter
The observations show that the material concentration changed substantially with depth and location in the YECS. For example, TSM was low at the surface and high at the bottom. In the horizontal distribution, the Subei coastal current carrying strongly turbid water extended across the 50-m isobaths to southwest of Cheju Island in autumn and winter; it is the major pathway of cross-shelf water exchange in the YECS (Yuan et al., 2008). As a result, the material concentration in water flowing onshore is usually different from that in water flowing offshore. Figure 3 shows the concentration distributions of POC, DOC, DIC and TSM across section TWCJ. The cross-shelf current (blue line, point numbers 30 to 70 in Figure 2) carries high-concentration coastal matter to the deep ocean across TWCJ. The concentration of intrusive matter transported by the Kuroshio and Yellow Sea Warm Current is relatively low. Notably, a there is a high-concentration core at the bottom between point numbers 60 and 70 in Figure 3, which came from the old Huanghe mouth and was transported by the East China Sea Current (Yuan and Hsueh, 2010).
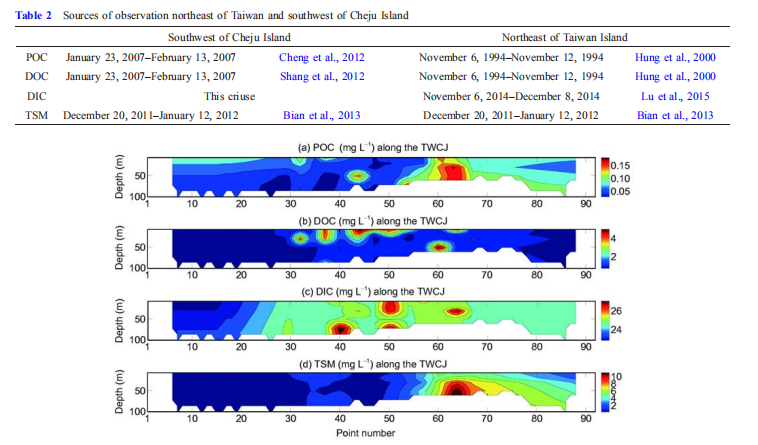
Figure 3 Concentrations of POC, DOC, DIC, TSM along section TWCJ in ECS during winter (combination of survey data of 2015 with previous observations (Table 2)).
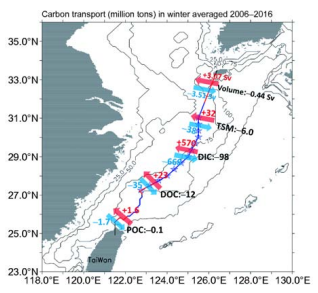
Figure 4 Volume (Sv) and carbon (million tons) transport across section TWCJ in winter (2006-2016) (red numbers, arrows, and lines show onshore transport, blue ones offshore transport, and black ones net transport; pentagrams show observations).
Because the onshore and offshore fluxes are usually larger than the net flux by one order of magnitude (Figure 2), the difference of carbon concentration in the water flowing onshore and offshore produces substantial cross-shelf carbon transport. Figure 4 shows cross-shelf volume and carbon transport in winter averaged over 2006 to 2016. Because carbon burial mainly occurs in winter (Saito and Yang, 1995;Hu and Yang, 2001; Iseki et al., 2003), cross-shelf carbon transport in that season was used to represent the principal carbon transport over the entire year. Overall in winter, there was net carbon transport from the ECS shelf to the deep sea. The net DIC transport was maximum (98 million tons), DOC was second (12 million tons), and POC the least (0.1 million tons). Most of the DOC is recalcitrant dissolved organic carbon, which is transported to the Kuroshio subsurface layer and becomes part of recalcitrant dissolved organic matter pool in the deep ocean (Jiao et al., 2010, 2011). Deng et al. (2006) estimated POC, DOC and DIC transport from the near-bottom layer to the open sea based on observations along section PN in winter. They calculated values of 0.25, 15-28 and 35 million tons, respectively, which match our results well. Fang et al. (2007) calculated the carbon sink of vegetation in China at about 0.096-0.106 (Pg C) a-1 (1PgC= 1015 g C). Our results show that the net cross-shelf transport of organic carbon in the winter ECS was ?12% of the annual mean carbon sink of land vegetation in China, which suggests that cross-shelf transport in the YECS in winter is important in the carbon cycle of the country.
POC is an important material basis in the biological food chain and the main form of carbon fixation and migration. Its vertical distribution is closely related to the concentration of TSM. Previous results (Zhang et al., 2004, 2006) show that the proportion of POC in suspended matter is similar in the near-bottom layer of the YECS, about 1.0-3.0%. Figure 4 shows six million tons net TSM transport across the shelf break to the deep ocean in the ECS during winter. Based on the proportion of POC in suspended matter, cross-shelf POC in the suspended matter is about 0.06 to 0.18 million tons. This is comparable to that calculated using the POC observation, which shows a consistency of results.
3.3Long-term variation of cross-shelf transport in winter
The cross-shelf transport has an increasing trend under the global warming scenarios. Both the simulations for RCP4.5 and RCP8.5 show that offshore volume transports across section TWCJ into the deep ocean in winter increase during the 21st century (Figure 5a). From 2006 to 2099, they increase about 0.54 and 0.65 Sv, respectively. The simulated cross-shelf transport for RCP8.5 is considerably larger than that for RCP4.5, indicating that continuous warming can intensify the transport. Compared with the transport across section TWCJ, offshore transport across the 200-m isobaths shows an opposite trend (Figure 5b). This decreases by 0.17 and 0.24 Sv from 2006 to 2099 for RCP4.5 and RCP8.5, respectively. The different trends across these two sections mainly result from different net transport directions. Net transport across the 200-m isobaths is onshore, with increasing trends in both RCP4.5 and RCP8.5 simulations (figures not shown). Enhanced convergence between TWCJ and the 200-m isobaths ultimately leads to transport increase across Tsushima Strait. All these results indicate that the cross-shelf transport becomes more active under global warming.
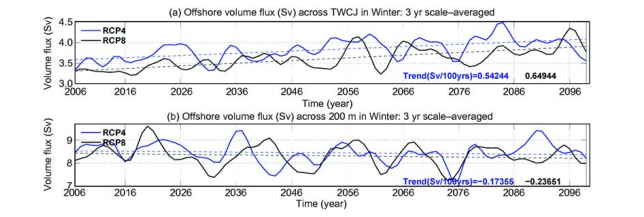
Figure 5 Long-term variations of offshore volume transport across section TWCJ (a) and 200-m isobaths (b) in winter (absolute value, 3-year running mean). Trend values are increase of flux on century time scale (Sv/100 years).
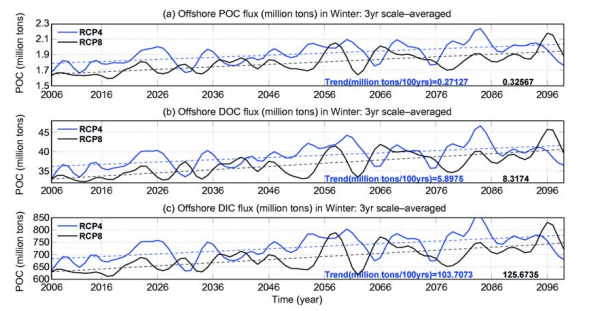
Figure 6 Long-term variations of POC (a), DOC (b) and DIC (c) offshore transport (million tons) across section TWCJ in winter (absolute value, 3-year running mean). Trend values are increase of flux on century time scale (million tons/100 years).
The offshore carbon transports across the TWCJ to the deep ocean also increase with volume transport (Figure 6). The simulations of RCP4.5 show that on a century time scale, winter offshore transports of POC, DOC and DIC across the TWCJ increase by 0.27, 5.9 and 103.7 million tons, respectively. Compared with the mean of the first ten years (2006-2016), offshore transports of POC, DOC and DIC increase by about 15.4%, 16.7% and 15.4% by the late 21st century, respectively. The RCP8.5-simulated transport is substantially larger than that of RCP4.5, with growth rates of 19.8%, 25.5% and 19.9%, respectively, indicating that continuous warming may intensify cross-shelf carbon transport. The net cross-shelf carbon transport also has an increasing trend in the range 6.5-21% (figures not shown). There are two reasons for this increase. First, the material concentration in water flowing offshore is usually larger than that in water flowing onshore (Figure 3). Second, though the net cross-shelf volume transport has little change, onshore and offshore volume transports both increase from 2006 to 2099. As the result of these two phenomena, the increased offshore transport carries more organic carbon away from the shelfs.
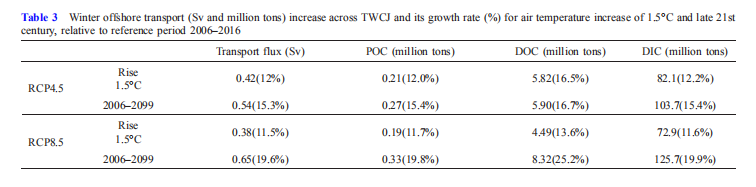
We calculated variations of offshore transport across section TWCJ to the open sea in the ECS for a global air temperature rise of 1.5 C (the ideal target adopted by the Paris Agreement). The increase of offshore transport and its growth rate in winter relative to the reference period 20062016 is shown in Table 3. According to the simulation ofthe greenhouse-gas emission reduction case (RCP4.5), the radiative forcing becomes stable and global air temperature will rise ?1.5 C in the middle of the 21st Century (2046- 2065), and then they almost have no change until the end of the 21st century (Table 1). Correspondingly, offshore transport across the TWCJ also reaches its peak at that time. In contrast with RCP4.5, air temperature will rise 1.5 C around 2045, and then continuously increase to 3.7 C by the late 21st century under the greenhouse gas continuous increase scenario (RCP8.5). Similarly, offshore transport continuously increases through the late 21st century. When the temperature rises 1.5 C, the offshore transport flux is about half that of the late 21st century, representing the carbon storage potential of the cross-shelf transport under continuous warming.
4. Conclusions
Based on Max-Planck coupled model simulations and in situ hydrological observations, we estimated the carbon flux across the Taiwan-Cheju section from the continental shelf to the deep ocean in the ECS during winter. The result shows a sizable net cross-shelf carbon flux to the deep ocean in the YECS in that season. The annual mean offshore carbon flux and annual mean net cross-shelf carbon flux to the deep ocean for the period 2006-2016 are 3.92 and 0.82 Sv, respectively. In comparison, the annual average net carbon flux across the 200-m isobath is 1.04 Sv. In winter, net transports of DIC, DOC and POC across the continental shelf to the deep ocean are 98, 12 and 0.1 million tons, respectively. The cross-shelf transport of DOC is 12% ofthe annual terrestrial vegetation carbon sink in China estimated by Fang et al. (2007). In winter, the net cross-shelf transport of suspended sediments to the deep ocean in the ECS is 6 million tons. This yields a cross-shelf POC transport of about 0.06 to 0.18 http://engine.scichina.com/doi/10.1007/s11430-017-9164-9 million tons, comparable to that calculated by water sample analysis, suggesting consistency of the estimates.
Long-term climate forecasts (2006-2099) under the global greenhouse-gas emission reduction (RCP4.5) and continuous increase (RCP8.5) scenarios show an increasing trend of cross-shelf carbon flux associated with global warming. According to simulated results of the RCP4.5 and RCP8.5 scenarios, winter cross-shelf transports to the open ocean increase from 2006 to 2099 by 0.54 and 0.65 Sv, respectively. As a result, the cross-shelf fluxes of POC, DOC, and DIC increase by 15.4%, 16.7%, and 15.4%, respectively, in the emission reduction scenario (RCP4.5). In the continuous emission increase scenario (RCP8.5), the cross-shelf transports of POC, DOC, and DIC increase continuously by 19.8%, 25.2%, and 19.9%, respectively. The cross-shelf transports in RCP8.5 are substantially larger than those in RCP4.5, suggesting intensified cross-shelf carbon fluxes from continuous warming. The winter cross-shelf carbon fluxes of the YECS and their changes under different emission scenarios were estimated for the first time. The results suggest the importance of cross-shelf transport in the carbon cycle of the China seas.
Because of a lack of long-term observations of suspended matter and carbon concentrations in the YECS, we only evaluated change of the carbon flux induced by intensified cross-shelf transport in the winter YECS associated with global warming. Change of carbon flux can also be induced by variations in carbon concentrations and the collective transport of so-called cross-shelf penetrating fronts, the carbon flux of which remains unknown because of a lack of observations and numerical simulations. Furthermore, satellite observations suggest that cross-shelf circulation in the YECS lasts into late autumn and early spring. Their crossshelf carbon flux was not included in our calculations, suggesting that the cross-shelf carbon flux may be underestimated in the present study. This paper underlines the importance of long-term continuous observations of carbon concentrations and cross-shelf transport in the ECS, toward understanding cross-shelf carbon flux in the marginal seas of China.
Acknowledgements We thank Dr. Su Jian and Prof. Thomas Pohlmannfrom the Max-Planek Institute fOr Meteorology fOr providing the mode data. We acknowledge the hard work of the cre^ws and scientists of the special survey of matter transport in the Yellow and East China seas in winter 2015. This work was supported by the Major Science Research Plan of China for Global Change Research (Grant No. 2012CB956001), the Special Program for Marine of the Chinese Academy of Sciences (Grant Nos. XDA11010205 & XDA11010304), the National Natural Science Foundation of China (Grant Nos. 41421005 & 41576016), the Key Foundation for International Cooperation (Grant No. 41720104008), the “Science Plan ofAoshan" Project of Qingdao National Laboratory for Marine Science and Technology (Grant No. 2016ASKJ04), the Special Program of State Oceanic Administration (Grant No. GASI-03-01-01-05), and the Project of Joint Funds of Shandong Province (Grant Nos. 2014GJJS0101
and U1406401).
References
Aldrian E, Sein D, Jacob D, Gates L D, Podzun R. 2005. Modelling Indonesian rainfall with a coupled regional model. Clim Dyn, 25: 1-17
Beardsley R C, Limeburner R, Yu H, Cannon G A. 1985. Discharge of the Changjiang (Yangtze River) into the East China Sea. Cont Shelf Res, 4: 57-76
Bian C, Jiang W, Quan Q, Wang T, Greatbatch R J, Li W. 2013. Distributions of suspended sediment concentration in the Yellow Sea and the East China Sea based on field surveys during the four seasons of 2011. JMar Syst, 121-122: 24-35
Cheng J, Shi X YZhang C S, Wang L S, Huang S, Liu D S. 2012. Spatial and temporal distribution of particulate organic carbon in the Yellow Sea and the East China Sea in Spring (in Chinese). Mar Environ Sci, 32: 2505-2511
Dai M H, Meng F F, Tang T T, Kao S J, Lin JL, Chen J H, Huang J C, Tian J W, Gan J P, Yang S. 2009. Excess total organic carbon in the intermediate water of the South China Sea and its export to the North Pacific. Geochem Geophys Geosyst, 10: Q12002
Deng B, Zhang J, Wu Y. 2006. Recent sediment accumulation and carbon burial in the East China Sea. Glob Biogeochem Cycle, 20, doi: 10.1029/ 2005GB002559
Fang J Y, Guo Z D, Piao S L, Chen A P. 2007. Terrestrial vegetation carbon sinks in China, 1981-2000. Sci China Ser D-Earth Sci, 50: 1341-1350
Guan B X. 1994. Patterns and structures of the currents in Bohai, Huanghai and East China Seas. In: Zhou D, Liang Y B, Zeng C K, eds. Oceanology of China Seas Volume 1. Dordrecht: Kluwer Academic Publishers. 17-26
Hu D X. 1994. Some striking features of circulation in Huanghai Sea and East China Sea. In: Zhou D, Liang Y B, Zeng C K, eds. Oceanology of China Seas Volume 1. Dordrecht: Kluwer Academic Publishers. 27-38
Hu D X, Yang Z. 2001. Key Process of Material Flux in the East China Sea (in Chinese). Beijing: China Ocean Press. 204
Hung J J, Lin P L, Liu K K. 2000. Dissolved and particulate organic carbon in the southern East China Sea. Cont Shelf Res, 20: 545-569
IPCC. 2013. Summary for Policymakers. In: Climate Change 2013: The Physical Science Basis. In: Stocker T F, Qin D, Plattner G K, Tignor M, Allen S K, Boschung J, Nauels A, Xia Y, Bex V, Midgley P M, eds. Contribution of Working Group I to the Fifth Assessment Report of the Intergovernmental Panel on Climate Change. Cambridge: Cambridge University Press
Iseki K, Okamura K, Kiyomoto Y. 2003. Seasonality and composition of downward particulate fluxes at the continental shelf and Okinawa Trough in the East China Sea. Deep-Sea Res Part II-Top Stud Oceanogr, 50: 457-473
Isobe A. 2008. Recent advances in ocean-circulation research on the Yellow Sea and East China Sea shelves. J Oceanogr, 64: 569-584
Jiao N Z, Herndl G J, Hansell D A, Benner R, Kattner G, Wilhelm S W, Kirchman D L, Weinbauer M G, Luo T, Chen F, Azam F. 2010. Microbial production of recalcitrant dissolved organic matter: Long-term carbon storage in the global ocean. Nat Rev Microbiol, 8: 593-599
Jiao N Z, Herndl G J, Hansell D A, Benner R, Kattner G, Wilhelm S W, Kirchman D L, Weinbauer M G, Luo T, Chen F, Azam F. 2011. The microbial carbon pump and the oceanic recalcitrant dissolved organic matter pool. Nat Rev Microbiol, 9: 555
Knap A, Michaels A, Close A, Ducklow H, Dickson A. 1996. Protocols for the Joint Global Ocean Flux Study (JGOFS) Core Measurements. JGOFS Report No. 19. Reprint of the IOC Manuals and Guides No. 29. Paris: UNESCO
Lin K, Guo B, Tang Y. 2001. An analysis on observational surface current in the Yellow Sea and the East China Sea. Cheju: Proceedings, Extended Abstract Volume, the 11th PAMS/JECSS Workshop, April 1113, 2001, 67-71
Lu X, Song J M, Yuan H M, Li N. 2015. Carbon distribution and exchange
Downloaded to IP: 124.17.27.99 On: 2018-10-17 14:43:40 http://engine.scichina.com/doi/10.1007/s11430-017-9164-9
of Kuroshio and adjacent china sea shelf: A review (in Chinese). Adv Earth Sci, 30: 214-225
Milliman J D, Shen H T, Yang Z S, Mead R H. 1985. Transport and deposition of river sediment in the Changjiang estuary and adjacent continental shelf. Cont Shelf Res, 4: 37-45
Munk W H. 1966. Abyssal recipes. Deep Sea Res Oceanogr Abstracts, 13: 707-730
Nitani H. 1972. Beginning of the Kuroshio. In: Stommel H, Yoshida K, eds. Kuroshio一Its Physical Aspects. Tokyo: University of Tokyo Press. 353-369
Qiao L, Huang L, Wang Z, Yao Z, Liu S. 2016. Flux and its seasonal variation of suspended particulate matter in the Bohai Sea, Yellow Sea and East China Sea. Geol J, 51: 22-34
Qiao L L, Wang Z, Liu S D, Li G X, Liu X, Huang L L, Xue W J, Zhong Y. 2017. From continental shelf seas to the western Pacific: the path and mechanism of cross-shelf suspended sediment transport in the Yellow Sea and East China Sea (in Chinese). Earth Sci Front, 24: 134-140
Saito Y, Yang Z. 1995. Historical change of the Huanghe (Yellow River) and its impact on the sediment budget of the East China Sea. In: Tsu- nogai, S, Iseki K, Koike I, Oba T, eds. Global Flux of Carbon and its Related Substances in the Coastal Sea-Ocean-Atmosphere System. Yokohama: M & J International. 7-12
Shang R N, Wang Z H, Zhang C S, Shi X Y. 2012. Distribution of Dissolved Organic Carbon in the Yellow Sea and East China Sea in Winter (in Chinese). Adv Mar Sci, 30: 94-101
Su J. 1998. Circulation dynamics of the China Seas north of 18 N. In: Robinson A R, Brink K H, eds. In The Sea, Volume 11. New York: John Wiley & Sons Inc. 483-505
Tsunogai S, Watanabe S, Sato T. 1999. Is there a “continental shelf pump" for the absorption of atmospheric CO2 ? Tellus B-Chem Phys Meteor, 51: 701-712
van Vuuren D P, Edmonds J, Kainuma M, Riahi K, Thomson A, Hibbard K, Hurtt G C, Kram T, Krey V, Lamarque J F, Masui T, Meinshausen M, Nakicenovic N, Smith S J, Rose S K. 2011. The representative concentration pathways: An overview. Clim Change, 109: 5-31
Wu K, Dai M H, Chen J H, Meng F F, Li X L, Liu Z Y, Du C J, Gan J P. 2015. Dissolved organic carbon in the South China Sea and its exchange with the Western Pacific Ocean. Deep-Sea Res Part II-Top Stud Oceanogr, 122: 41-51
Xiao H H, Wang H J, Bi N S, Wu X, Wang A M, Zhang Y. 2015. Seasonal variation of suspended sediment in the Bohai and Yellow Sea and the pathway of sediment transport (in Chinese). Mar Geol Quat Geol, 35: 11-21
Yuan D L, Hsueh Y. 2010. Dynamics of the cross-shelf circulation in the Yellow and East China Seas in winter. Deep-Sea Res Part II-Top Stud Oceanogr, 57: 1745-1761
Yuan D L, Zhu J, Li C Y, Hu D X. 2008. Cross-shelf circulation in the Yellow and East China Seas indicated by MODIS satellite observations. J Mar Syst, 70: 134-149
Zhang J, Guo X Y, Zhao L, Miyazawa Y, Sun Q. 2017. Water exchange across isobaths over the continental shelf of the East China Sea. J Phys Oceanogr, 47: 1043-1060
Zhang Y S, Zhang F J, Guo X W, Zhang M P. 2004. Vertical flux of the settling particulate matter in the water column of the Yellow Sea in summer (in Chinese). Oceanol Limnol Sin, 35: 230-238
Zhang Y S, Zhang F J, Guo X W, Zhang M P. 2006. Autumn flux of particle settling observed at three representative stations in East China Sea (in Chinese). Oceanol Limnol Sin, 37: 28-34
Zhou F, Xue H J, Huang D J, Xuan J L, Ni X B, Xiu P, Hao Q. 2015. Cross-shelf exchange in the shelf of the East China Sea. J Geophys Res- Oceans, 120: 1545-1572
(Responsible editor: Nianzhi JIAO)