

Exploring seasonal acidification in the Yellow Sea
Weidong ZHAI
Institute of Marine Science and Technology, Shandong University, Jinan 250100, China
Received September 10, 2017; revised October 24, 2017; accepted November 28, 2017; published online February 6, 2018
Abstract
The Yellow Sea on the western continental margin of the North Pacific Ocean is of major ecological and economic importance. Four field surveys were conducted during May and November 2012, August 2015, and January 2016, investigating seasonal variations in dissolved oxygen and carbonate system parameters of this marginal sea. Results showed that the Yellow Sea cold water mass accumulated respiration-induced CO2 in subsurface and bottom waters in summer and autumn, leading to acidified seawaters with critical carbonate saturation states of aragonite (Qarag) of less than 1.5. These seriously acidified seawaters occupied one third of surveyed areas in summer and autumn, likely affecting local calcified organisms and benthic communities. In afuture scenario for the 2050s, in which the atmospheric CO2 molefraction increases by 100 呻ol mol 1, half of the Yellow Sea benthos would be seasonally covered by acidified seawater having a critical of less than 1.5. The corresponding bottom-water pHT would be around 7.85 in summer, and 7.80 in autumn. Of the China seas, the Yellow Sea cold water mass represents one of the ecosystems most vulnerable to ocean acidification.
Keywords CaCOg saturation state, Ocean acidification, Yellow Sea, pH, Dissolved oxygen, Benthic communities
Citation: Zhai W D. 2018. Exploring seasonal acidification in the Yellow Sea. Science China Earth Sciences, 61: 647-658, https://doi.org/10.1007/s11430-017- 9151-4
1. Introduction
Since the beginning of the industrial period, global oceans have absorbed ?41% of anthropogenic CO2 emissions from fuel combustion and cement production (Ciais et al., 2013). This absorption has induced several significant changes, including the decline in ocean's surface water pH of 0.12 (Caldeira and Wickett, 2003; Doney et al., 2009), and a decline in the upper ocean's chemical buffering capacity (against atmospheric CO2 dynamics) of 30% (Sabine et al., 2004; Zhai and Zhao, 2016). This so-called ocean acidification leads not only to pH decline, but declines in the sea surface carbonate saturation state (Feely et al., 2012)一an essential environmental parameter for growth and development of marine calcifying organisms (Waldbusser et al., 2015), such as corals, shellfish, and pteropods (wing-footed
Corresponding author (emails: wdzhai@126.com; wdzhai@sdu.edu.cn)
mollusks that feed on several commercial fish species). It has been predicted that by the middle of this century, shellfish and pteropods in middle to high latitudes will live under conditions of acidification-induced aragonite-shell dissolution (Orr et al., 2005). Moreover, ocean acidification may increase the accumulation of toxic phenolic compounds in the food chain (Jin P et al., 2015). This will certainly affect any non-calcifying marine species, which are seemingly insensitive to acidification.
Ocean margin ecosystems are likely to be more vulnerable to negative effects of ocean acidification than open ocean ecosystems (e.g., Cai et al., 2011). In productive coastal ocean areas, algae and other biogenic particles decompose in subsurface waters. Their respiration and/or remineralization processes consume dissolved oxygen (DO) and release a great deal of CO2 into subsurface waters via eq. (1), leading to rapid seawater acidification in coastal oceans, compared with open oceans.
This remineralization-induced coastal acidification is usually associated with eutrophication and seasonal hypoxia (Borges and Gypens, 2010; Feely et al., 2010; Melzner et al., 2013). It is fundamentally different from global-scale atmospheric CO2-induced ocean acidification (Duarte et al., 2013). However, this remineralization-induced coastal acidification can, in 2-3 months, amount to sea surface acidification progress of 50 to 150 years into the future in open oceans (Zhai et al., 2012, 2014). Such remineralization- induced coastal acidification may cause much more stress to local organisms. Furthermore, seasonal seawater acidification is bound to enhance negative effects related to elevated atmospheric CO2-induced ocean acidification, because of decreased chemical buffering under high CO2 conditions (Cai et al., 2011).
To determine the severity of the threat of acidified seawater in coastal oceans to marine calcifying organisms, a CaCO3 saturation state of aragonite (。财)of ?1.5 is used as a critical threshold for shellfish and other calcifying organisms (Gruber et al., 2012; Ekstrom et al., 2015; Waldbusser et al., 2015). Theis a measure of the chemical potential of calcifying marine species to form aragonite skeletons or shells in seawater. It is defined as the product of calcium and carbonate ion concentrations divided by the apparent solubility product (K$p*) for aragonite. Chemically, a Qarag>1 indicates that aragonite is stable in seawater, while a drag<1 indicates that it is unstable. The real situation in the marine environment is much more complex than the chemical definition above. In middle to lower latitudes, some coral calcic skeletons may undergo dissolution, even at relatively high Qarag levels of 2-3.5 (Yamamoto et al., 2012).
The Yellow Sea一a marginal sea of the western North Pacific region一is known throughout the world for its productive fishery. However, the remarkable metabolic activities of its biological communities have led to seasonal acidification in its cold water mass in summer and autumn (State Oceanic Administration of China, 2013; Zhai et al., 2014; Xu et al., 2016). Likely because of eutrophication- enhanced ocean acidification, a recent study suggests that the species richness contribution of echinoderms to the macrobenthos of the Yellow Sea has declined over the last three decades (Jin S F et al., 2015). Meanwhile, China is planning to develop offshore aquaculture within the South Yellow Sea (e.g. http://www.xumurc.com/main/ShowNews_43285. html). Expanding on earlier findings, this study attempts to define general features, characteristics, and driving processes of this seasonal acidification, especially within the South Yellow Sea, to provide scientific guidance for the economic development of this region.
The Yellow Sea has a total area of ?0.37x10⁶ km2. It is geographically divided into two basins, i.e., the North Yellow Sea and the South Yellow Sea (Figure 1). The North Yellow Sea is surrounded by Liaoning and Shandong provinces of China, and the Democratic People's Republic of Korea, as well as being connected to the Bohai Sea to the west. The South Yellow Sea is connected to the East ChinaSea to the south. The North Yellow Sea has an area of ?70x103 km2 and a mean water depth of 38 m, while the South Yellow Sea has an area of ~300x103 km2 and a mean water depth of 44 m. The deepest water depth of 103 m occurs within the eastern basin of the South Yellow Sea, near the Republic of Korea. The East Asian Monsoon primarily dominates climatic variations of the Yellow Sea (Chen, 2009). The rain-bearing southwest monsoon lasts from June to early September, while the strong northeast monsoon prevails in autumn, winter, and early spring, from November to March of each year (Zhai et al., 2014). During the northeast monsoon period, the general circulation is characterized by a strong southward-moving coastal current and the northward-moving Yellow Sea Warm Current (YSWC) within its central basin area. The YSWC is considered a compensating current to the northeast monsoon-driven coastal current, transporting saline open ocean waters into the Yellow Sea (Figure 1; Chen, 2009). During the southwest monsoon period, the summertime hydrography across the Yellow Sea is characterized by a pronounced stratification in its deeper regions. A cold pool develops, typically with water temperatures of 8-11 C, which is overlain by 15 to 25 m of warm water. It is regarded as being the remnant of the previous winter's cooling and is known as the Yellow Sea Cold Water Mass (YSCWM; Figure 1c). Fed by nutrient inputs from both atmospheric dry/wet deposition (Zhang, 1994; Shi et al., 2012; Tan and Wang, 2014) and subsurface regeneration processes, algal blooms are often observed in April (Shi et al., 2012; He et al., 2013; Tan and Wang, 2014). These algal blooms probably cause sinking particulate organic matters, leading to subsurface oxygen depletion and pH decline (Zhai et al., 2014; Xu et al., 2016).
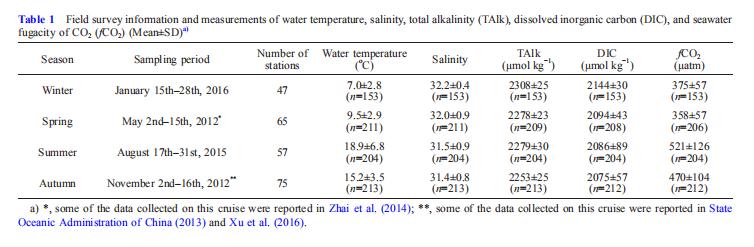
In this study, field surveys were carried out in May 2012, November 2012, August 2015, and January 2016, covering all four seasons (Table 1). The survey area covered ?50% of the Yellow Sea (Figure 1a). During these surveys, water samples were collected at 47-75 grid stations to measure water column dissolved oxygen (DO) and aqueous carbonate system parameters.
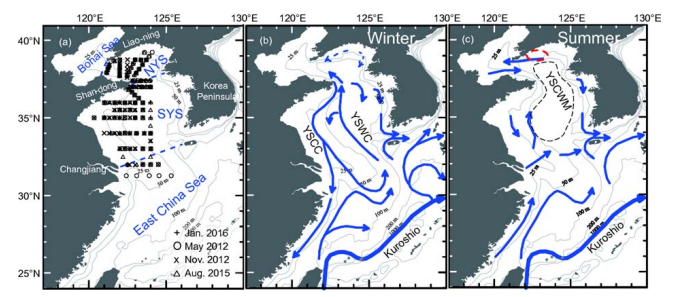
Figure 1 Maps showing sampling sites (a), and circulation in summer (b) and winter (c). In panel (a), depth contours of 25, 50, 100, 200 and 1000 m are shown as thin gray lines, while boundaries of the Bohai Sea, North Yellow Sea (NYS), South Yellow Sea (SYS), and East China Sea are shown as blue dashed lines. In panel (b), YSCC=Yellow Sea Coastal Current, and YSWC=Yellow Sea Warm Current (Zang et al., 2003). In panel (c), YSCWM=Yellow Sea Cold Water Mass (Chen, 2009), while a major marine aquaculture zone in the NYS is enclosed within a red ellipse (Zhai et al., 2014).
Depth profiles of temperature (after the International Temperature Scale of 1990) and salinity (after the Practical Salinity Scale of 1978) were determined with calibrated conductivity-temperature-depth/pressure (CTD) recorders (SBE911+; Sea-Bird Scientific, USA) aboard R/V Dong-fanghong 2. Water samples for DO, dissolved inorganic carbon (DIC) and total alkalinity (TAlk) were obtained at two to four different depths, using rosette samplers fitted with 12-L Niskin bottles (General Oceanics, USA), which were mounted with CTD recorders. The bottom-water samples were collected from a depth of 2-3 m above the sea bed.
Water samples for DO analyses were collected, fixed, and titrated while on board the vessel, following the classic Winkler procedure. Any possible nitrite interference in the DO titration was removed by adding 0.01% NaNg during subsample fixation (Wong, 2012). DO saturation was calculated from field-measured DO concentrations by dividing by the DO concentration at equilibrium with the atmosphere. This equilibrium value was calculated using the Benson and Krause (1984) equation. To quantify the effects of net community metabolism, apparent oxygen utilization (AOU) was also calculated by subtracting the field-measured DO concentration from the DO concentration at equilibrium with the atmosphere. Ignoring effects of air-sea exchange and water mixing, an AOU>0 implies net community respiration, while an AOU<0 implies net community production.
Water samples for DIC and TAlk analyses were also prepared on board. They were unfiltered, but allowed to settle before measurement. As recommended by Huang et al. (2012), they were stored in 60-mL borosilicate glass bottles (for DIC) and 140-mL high-density polyethylene bottles (for TAlk). Immediately after subsample collection, they were mixed with 50 pL saturated HgCl?, sealed with screw caps, and stored at room temperature. Both DIC and TAlk data were collected using commercial analytical systems (models AS-C3 and AS-ALK1+, Apollo SciTech Inc., USA). Briefly, DIC was measured by infrared detection, following acid extraction ofa0.5 mL sample with a Kloehn? digital syringe pump (Kloehn Company Ltd., USA). TAlk was determined by Gran acidimetric titration of a 25-mL sample with another Kloehn? digital syringe pump, using a precision pH meter (Orion Star?, Thermo Electron Co., USA) and an Orion? 8102BN Ross electrode (Thermo Electron Co., USA). Certificated Reference Materials from A. G. Dickson's lab were used for quality assurance during analyses, achieving a precision level of 2 卩mol kg-1 (Zhai et al., 2014).
The seawater fugacity of CO2 (/CO2), pHt (the negative logarithm of the total concentration of H+ and HSO4 ions), and Qmag were calculated from DIC, TAlk, seawater temperature, and salinity values using the calculation program CO2SYS.xls (Pelletier et al., 2015), which is an updated version of the original CO2SYS.EXE (Lewis and Wallace, 1998). The dissociation constants for carbonic acid were those determined by Millero et al. (2006), and the dissociation constant for the HSO; ion was determined, as per Dickson (1990). The Kj values for aragonite were taken from Mucci (1983), while the Ca2+ concentrations were assumed to be proportional to salinity, as discussed in Millero (1979). To assess the quality of the carbonate system data, we also calculated pH data using the National Bureau of Standards (NBS) scale based on DIC and TAlkvalues. These data were compared with field-measured pH data (also obtained using the NBS scale). Most measured and calculated values were consistent (Zhai et al., 2014), suggesting that measurements of the carbonate system parameters were reliable.
3. Results
3.1Data overview
In winter, the survey-average seawater temperature was only 7.0 2.8 C (Table 1); lower temperatures of 0.87-3.0 C were measured (Figure 2a) at several nearshore sampling sites. In spring, the survey-average seawater temperature 9.5 2.9 C was slightly higher than in winter. The lowest spring seawater temperature was 3.9 C (Figure 2b). In summer, sea surface temperature ranged from 22.8 to 29.6 C, while subsurface and bottom water temperatures usually remained at springtime levels of 6.6-11.8 C (Figure 2c). The highest survey-average seawater temperature 18.9 6.8 C was recorded in summer (Table 1). In autumn, the survey-average seawater temperature 15.2 3.5 C was lower than in summer, but higher than in winter or spring (Table 1).
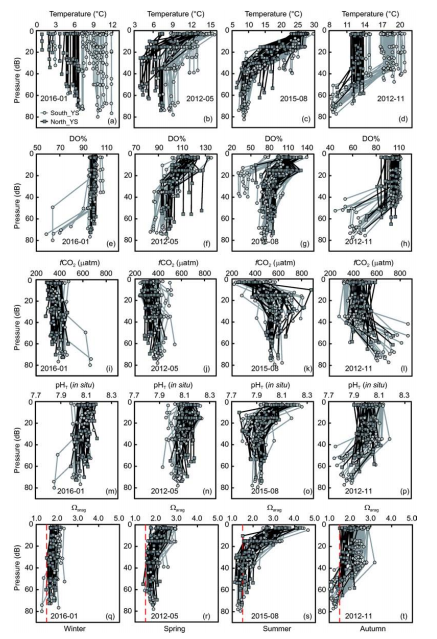
Figure 2 Vertical profiles for seawater temperature ((a)-(d)), dissolved oxygen saturation ((e)-(h)), fugacity of CO2 ((i)-(l)), pH ((m)-(p)), and CaCO3 saturation of aragonite ((q)-(t)) in winter, spring, summer, and autumn.
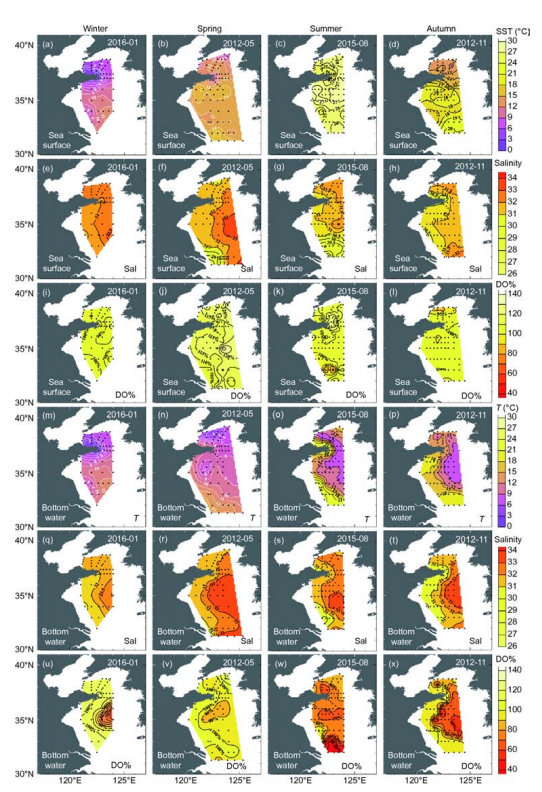
Figure 3 Distributions of sea surface and bottom water temperature, salinity, and dissolved oxygen saturation in winter, spring, summer, and autumn.
The survey-average salinity was 32.2 0.4 in winter, 32.0 0.9 in spring, 31.5 0.9 in summer, and 31.4 0.8 in autumn (Table 1). Figure 3 shows that saline sampling sites (having sea surface salinity >32) in winter and spring were affected by the YSWC (Figure 1b), while the low-temperature bottom waters in summer and autumn also had relatively high salinity values of >32. This is consistent with the abovementioned viewpoint that the summertime YSCWM is the remnant of the previous winter's cooling to a large Significant stratification occurred in the YSCWM in summer and autumn (Figure 2c and d), leading to marked AOU values and accumulations of respiration-induced CO2 in the subsurface and bottom waters. Most winter and spring sampling sites had DO at ?100% saturation, except for sampling sites in the central part of the South Yellow Sea, where quite low DO saturations of 58-79% occurred in bottom waters in winter (Figures 2 and 3). Correspondingly, their fCO2 mostly ranged from 300 to 430 卩atm in winter, close to the present-day air-equilibrated CO2 partial pressure level (~390 卩atm). In summer and autumn, the subsurface and bottom water DO saturations were usually much lower than the air-equilibrated level (Figure 2). Aside from some South Yellow Sea sampling sites near the Yangtze Estuary, where the summer bottom water DO was measured at 30 -52% saturation, the Yellow Sea was characterized by summer bottom water DO saturations of 60-88% and autumn bottom water DO saturations of 45-98% (Figure 3). Correspondingly, the Yellow Sea bottom water fCO2 mostly ranged from 480 to 860 卩atm in summer and autumn (Figure 4), which was much higher than the air-equilibrated CO2 partial pressure level.
3.2Characteristics of the carbonate system and seasonal acidification
The average values and standard deviations of TAlk measured on winter, spring, and summer surveys (Table 1) were all close to values previously reported for the North Yellow Sea by Zhai et al. (2014), i.e., around 2290 25 卩mol kg-1. During autumn, however, a relatively low average TAlk of 2253 25 卩mol kg-1 was measured. This likely indicates the influence of an open ocean water intrusion via the YSWC during the northeast monsoon season (Figure 1; Chen, 2009), which is supported by a relatively high-salinity bottom water intrusion (S>33.0) in the southeastern part of the study area in November (Figure 3f). The DIC data had higher standard deviations in summer and autumn than in winter and spring, while the/CO2 data had higher average values in summer and autumn than in winter and spring (Table 1). These phenomena suggest that DIC accumulation occurs in summer and autumn, which dominates the seasonal carbonate system in the Yellow Sea.
4. Discussion
4.1 Processes controlling acidification of the Yellow Sea Cold Water Mass
TAlk is a quasi-conservative parameter. Plots ofTAlk versus salinity suggest that many potential water sources mutually affected the carbonate system in the Yellow Sea (Figure 5). In contrast, DIC is largely affected by metabolic processes. Photosynthesis in the sea surface removes DIC from seawater, while subsurface respiration/remineralization adds DIC to seawater. The YSCWM (having relatively low temperature and high salinity) had higher DIC in summer and autumn than in spring (Figures 5 and 6). Correspondingly, a summer increase in AOU and decline inwere also observed in the YSCWM (Figure 6c-f). Although variation in TAlk will clearly affect。疵君,the Yellow Sea Qarag value appears to be primarily determined by DIC (Figure 7). As DIC accumulated, a lowerwas obtained.
The ideal relationship betweenand DIC was estimated using the calculation program CO2SYS.xls (forS=32, and TAlk=2290 卩mol kg-1) (Figure 7). Comparisons between measured and modeled results suggest that changes of Qarag in the Yellow Sea can be fairly well expressed as a function of DIC (Figure 7a and b). Temperature changes (8 -25 C) in the Yellow Sea appear to have limited influence on the relationship between Qarag and DIC (Figure 7c).
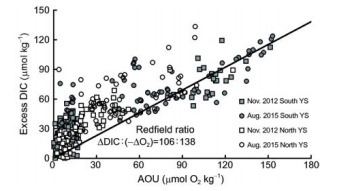
Figure 8 Plot of the excess DIC relative to air-equilibrated values versus apparent oxygen utilization in summer and autumn. Only positive data are presented here.
To study possible DIC sources of the high fCO2 and low Qarag in summer and autumn in the Yellow Sea, the airequilibrated DIC (DICequ, corresponding to a fCO2 of ~390 卩atm) was calculated from field-measured seawater temperature, salinity, and TAlk values. The DIC departure from DICequ was defined as the excess DIC (ExcessDIC). Thus, an Excess DIC>0 means net community respiration, while an Excess DIC<0 implies net community production, when effects of air-sea exchanges, water mixing, and CaCOg pre- cipitation/dissolution are ignored. Figure 8 shows that the relationship between ExcessDIC and AOU is fairly consistent with the traditional Redfield ratio, suggesting that community respiration played a dominant role in the seasonal accumulation of DIC in the YSCWM. According to Zhai et al. (2014), the net DO consumption rate is approximately 1 卩mol O2 kg-1 d-1 in the northern area of the YSCWM. Based on this net DO consumption rate, it takes less than 150 d (i.e.,?5 months) to form the autumn maximum AOU value of 150 卩mol O2 kg-1 (Figure 8), and thereby the autumn low Qarag of bottom waters (Figure 4). This time lag is consistent with the fact that the YSCWM forms in May, and is sustained until November each year. It is worth noting that some summer AOU data were as high as 100-150 卩mol O2 kg-1 in August (Figures 6f and 8). The relevant sampling stations were all located in the southern area of the South Yellow Sea, where relatively low salinities of 29-31 were measured (Figure 3), corresponding to the Changjiang diluted water. According to Chen et al. (2006), the Changjiang diluted water has a much higher community respiration rate than 1 卩mol O2 kg-1 d-1. Eliminating the stations affected by the Changjiang diluted water, the summertime AOU in the Yellow Sea was rarely higher than 100 卩mol O2 kg-1 (Figure6e and f). Given a Yellow Sea net DO consumption rate of 1 卩mol O2 kg-1 d-1, this implies that it takes only ~3 months to form the summer AOU conditions of 100 卩mol O2 kg-1. This is a reasonable time lag between formation of the YSCWM in May, and measurements during the sampling survey in August of 2015. In the North Yellow Sea, some summer data deviated from the Redfield relationship (Figure 8), presumably linked to other biogeochemical processes, such as CaCO3 precipitation during spring and summer, and/ or an imbalance between CO2 air-sea exchange and seawater ventilation (Zhai et al., 2014). The cause of such deviation needs more investigation.
4.2Projection of possible changes in the 2050s
Most climate change models have predicted that the global average atmospheric CO2 mole fraction will rise to 492-541 卩mol mol-1 in the 2050s (Gruber et al., 2012), i.e., ~100 卩mol mol-1 higher than the present-day level of ~400 卩mol mol-1. Figure 2 shows that the carbonate system within the Yellow Sea seawater column re-equilibrated with atmospheric CO2 every year during the period from winter to spring. Therefore, a global atmospheric CO2 rise will certainly lead to higher winter DIC values in the Yellow Sea. Under conditions in which salinity and TAlk remain at similar levels to the present-day, any increase in DIC (either related to respiration or a rise in atmospheric CO2) in the Yellow Sea would result in a decrease in seawater Q^g (Figure 7). The resulting seawatercan be roughly predicted by the DIC value (Figure 7). Thus, when the YSCWM DIC is higher than 2170 卩mol kg-1, then the Qarag value of this seawater body will reach the threshold value of ?1.5, seriously threatening shellfish and other calcified organisms. This DIC value corresponds to a seawater fCO2 of 510-580 卩atm in the YSCWM for seawater temperatures of 8-11 C. A much higher /CO2 is already observed in deeper waters of the Yellow Sea in summer and autumn (Figures 2 and 4).
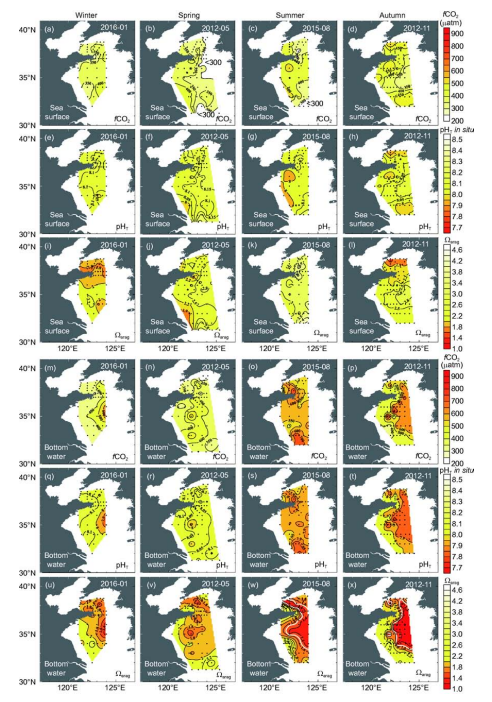
Figure 4 Distributions of sea surface and bottom water fugacity of CO2, pH, and CaC 3 saturation of aragonite (Qarag) in winter, spring, summer, and autumn. In panels (w) and (x), contours of bottom water Qarag=1.5 are plotted as thick white lines.
Figure 4 shows that in the YSCWM bottom waters with a high/CO2, seawater pH and Q^g were both relatively low in summer and autumn. At many sampling sites, bottom water pHt varied from 7.98 to 8.19 in winter and spring, but from 7.79 to 7.98 in summer, and from 7.74 to 7.94 in autumn (Figure 2m-p). In contrast, bottom water Q^g decreased from values of 1.57-2.19 in winter and spring to values of 1.13-2.00 in summer and values of 1.02-2.21 in autumn (Figure 2q-t). It is worth noting that the lowvalues of less than 1.5 occupied 65000 and 67000 km2 of the Yellow Sea benthic-inhabited area in summer and autumn, representing areas of 35.5% (in summer) and 32.6% (in au- seasonal acidification undoubtedly has a significant impact on this marginal sea ecosystem, and clearly deserves further
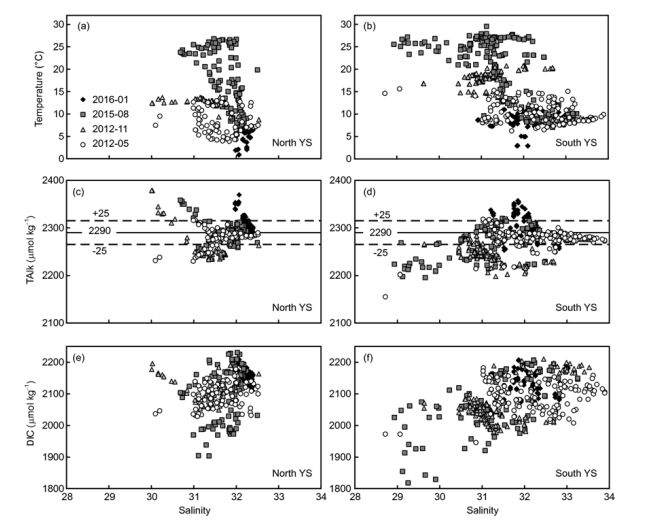
Figure 5 Plots of temperature versus salinity ((a), (b)), total alkalinity (TAlk) versus salinity ((c), (d)), and dissolved inorganic carbon (DIC) versus salinity ((e), (f)). A typical TAlk of 2290 25 卩mol kg-1 is recorded by Zhai et al., (2014).
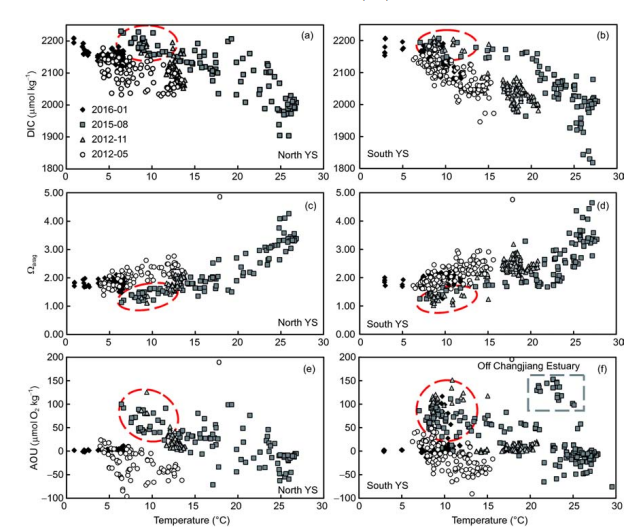
Figure 6 Plots of dissolved inorganic carbon (DIC) versus seawater temperature ((a), (b)), CaCO3 saturation of aragonite (Qarag) versus seawater temperature ((c), (d)), and apparent oxygen utilization (AOU) versus seawater temperature ((e), (f)). Data for the cold water mass in summer and autumn are enclosed within a red ellipse, while data showing the influence of the Changjiang diluted water are enclosed within a grey box.
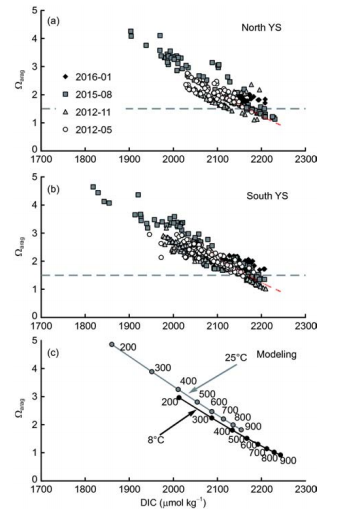
Figure 7 Plots of CaCO3 saturation of aragonite (Qarag) versus dissolved inorganic carbon (DIC). Dashed red lines in panels (a) and (b) are the same as the 8 C line in panel (c), while the dashed grey line shows the critical Qarag value of 1.5 for calcifying organisms such as shellfish (Gruber et al., 2012; Ekstrom et al., 2015; Waldbusser et al., 2015). In panel (c), calculated data are based on a salinity of 32 and TAlk of 2290 pmol kg-1, while seawater fugacity of CO2 changed from 200 to 900 卩atm. The two seawater temperatures of 8 and 25 C represent typical summer values for the Yellow Sea cold water mass and sea surface temperatures (Figure 2c), respectively.
To evaluate possible changes in the Yellow Sea carbonate system in a future scenario for the 2050s, it was assumed that both ocean circulation (including the summertime cold water mass and stratification) and TAlk will remain relatively unchanged over the next few decades. In this case, the CO2 release related to community respiration, as well as the increment increase in DIC caused by ongoing atmospheric CO2 intrusion will jointly affect the Yellow Sea Q^g values in summer and autumn. All other parameters, such as seawater temperature, salinity, TAlk, community metabolic rate (especially the net respiration rate), summer stratification, and winter mixing, were assumed to be similar to the present- day scenario. Thus, atmospheric CO2 rise was the only difference between the present-day and the future scenarios.
Using predictions of the atmospheric CO2 increment (~100 卩mol mol-1) for the middle of this century (Gruber et al., 2012), the present-day Yellow Sea fCO2 data (Figure 4) were scaled for this change in atmospheric CO2 mole fraction. The results suggest that in summers and autumns of the2050s, half of the Yellow Sea (mostly within the YSCWM) would be seasonally occupied by the acidified seawater, having a bottom-water fCO2 higher than 510 卩atm (at 8 C), yielding critical Qarag values of <1.5. The lowest Qarag value may even reach <1.0. The corresponding pHT would be ?7.85 in summer and ?7.80 in autumn.
Clearly, many other factors may affect the YSCWM chemical environment over the next 30 years. In addition to a direct response to the atmospheric CO2 rise, microbial communities in the Yellow Sea may be altered by eutrophication and ongoing ocean acidification, leading to net changes in the community respiration rate. Therefore, the actual situation in the future may deviate from the simplified forecast above. However, the findings of this study indicate that acidification capable of threatening the Yellow Sea ecosystems could develop within several decades, not centuries. To manage such chemical changes, immediate and regular monitoring should be carried out within the Yellow Sea.
As for sea surface carbonate system dynamics, because primary production processes could consume quite a lot of DIC from the euphotic zone, it is not easy to form a wide area of low Qarag in surface waters of the Yellow Sea in warm seasons. Only in winter, under conditions of low seawater temperature and weak biological activity, the Yellow Sea could respond to a global atmospheric CO2 rise along the 8 C line shown in Figure 7c, forming a wide area of low surface water.
4.3Effects of CO2-driven seawater acidification on the Yellow Sea ecosystems
Some laboratory studies have shown that several important physiological functions of bivalves, such as food intake, oxygen consumption, and ammonia excretion, could be damaged by CO2-induced seawater acidification. This would occur even in adult individuals during short-term exposure (Liu and He, 2012; Xu et al., 2013). Echinoderms are also sensitive to the CO2-driven seawater acidification. For ex-ample, a decrease in seawater pH would lead to declines in growth rates, energy consumption, and defecation rates of the Yellow Sea native sea cucumber (Yuan et al., 2016). Yuan et al. (2015) also observed negative effects related to the CO2-driven seawater acidification on various larval stages of the sea cucumber. It is likely that the complex tidal currents and wind currents in coastal oceans will occasionally drive acidified YSCWM water into shellfish and sea cucumber habitats, leading to unpredictable heavy losses. Considering aquaculture enterprises (enclosed by the red ellipse in Figure 1c) that depend on the cold waters of the North Yellow Sea, this could pose a serious environmental risk. Clearly, this seawater acidification deserves more attention.
In acidified seawater, shellfish may become smaller (Garilli et al., 2015). In the Bohai Sea, near to our study area, recent field surveys have shown that macrozoobenthos, such as shrimps and crabs having larger sizes and longer life spans, have been substituted by more tolerant bivalve species having smaller sizes and shorter life spans (Cai et al., 2013; Liu et al., 2014). This presumably reflects the combined stress of periodical/occasional acidification (Zhai et al., 2012) and increased human activities in this area. Another study suggests that the species richness contribution of echinoderms to the macrobenthos of the Yellow Sea has declined over the last three decades, likely related to eutrophication-enhanced ocean acidification (Jin S F et al., 2015). Although a causal relationship between these phenomena and marine carbonate system chemistry remains unconfirmed, the continuing acidification of marine environments will undoubtedly affect both structure and function of benthic communities in the Yellow Sea.
5. Conclusions
In the YSCWM, subsurface community respiration produced a large amount of CO2 in summer and autumn. This biogenic CO2 was accumulated in the cold water mass of the Yellow Sea, leading to significant seawater acidification in summer and autumn. At present, one third of the surveyed areas in the Yellow Sea suffer from serious bottom seawater acidification (Qarag<1.5) during summer and autumn. The acidified bottom seawater had a pHp value of ?7.90. If the atmospheric CO2 was to rise to 500 卩mol mol-1 in the 2050s, while the Yellow Sea hydrological conditions and community respiration rate were to remain similar to the present-day, then it is likely that 50% of the Yellow Sea's benthos (mainly within the cold water mass region) will be affected by seriously acidified seawater (having a Qarag<1.5 or even Qarag<1.0) in summer and autumn. A corresponding pHp of ?7.85 in summer and ?7.80 in autumn would result. It is not clear how the structure and function of benthic ecosystems will be affected by the serious stress of coastal acidification. It is also important to understand how biogeochemical patterns (including geochemistry of sediments) will respond to such environmental change. These aspects are worth serious investigation in the near future.
Acknowledgements Nan Zheng, Pengfei Liu, and Ru Li from the NationalMariHe EnvironmentalMonitoriHg CenterofChina are thankedfor collectingprimary data on carbonate systems, while Prof. Houjie Wang and the crew of R/V Dongfanghong 2 provided technical help during cruises. Valuable comments and suggestion from four anonymous reviewers have greatly improved the quality of this paper This work was supported by the State Key R&D Project of China (Grant No. 2016YFA0601103), the National Natural Science Foundation of China (Grant Nos. 91751207 & 41276061), the Visiting Fellowship in the State Key Laboratory of Marine Environmental Science (Xiamen University), and the Fundamental Research Funds of Shandong University. Sampling surv^^s were supported by the National Natural Science Foundation of China Open Ship-Time Projects in 2012 and 2015.
References
Benson B B, Krause Jr D. 1984. The concentration and isotopic fractionation of oxygen dissolved in freshwater and seawater in equilibrium with the atmosphere】. Limnol Oceanogr, 29: 620-632
Borges A V, Gypens N. 2010. Carbonate chemistry in the coastal zone responds more strongly to eutrophication than ocean acidification. Limnol Oceanogr, 55: 346-353
Cai W J, Hu X P, Huang W J, Murrell M C, Lehrter J C, Lohrenz S E, Chou W C, Zhai W D, Hollibaugh J T, Wang Y C, Zhao P S, Guo X H, Gundersen K, Dai M H, Gong G C. 2011. Acidification of subsurface coastal waters enhanced by eutrophication. Nat Geosci, 4: 766-770
Cai W Q, Meng W, Liu L S, Zhu Y Z, Zhou J. 2013. Long-term trends of the dominant macro-zoobenthos in Bohai Bay (in Chinese). Acta Sci Circum, 33: 2332-2340
Caldeira K, Wickett M E. 2003. Anthropogenic carbon and ocean pH. Nature, 425: 365-365
Chen C C, Chiang K P, Gong G C, Shiah F K, Tseng C M,Liu K K. 2006. Importance of planktonic community respiration on the carbon balance of the East China Sea in summer. Glob Biogeochem Cycle, 20: GB4001
Chen C T A. 2009. Chemical and physical fronts in the Bohai, Yellow and East China seas. J Mar Syst, 78: 394-410
Ciais P, Sabine C, Bala G, Bopp L, Brovkin V, Canadell J, Chhabra A, DeFries R, Galloway J, Heimann M, Jones C, Le Quere C, Myneni R B, Piao S, Thornton P. 2013. Carbon and other biogeochemical cycles. In: Stocker T F, Qin D, Plattner G K, Tignor M, Allen S K, Boschung J, Nauels A, Xia Y, Bex V, Midgley P M, eds. Climate Change 2013. The Physical Science Basis, Contribution of Working Group I to the Fifth Assessment Report of the Intergovernmental Panel on Climate Change. Cambridge: Cambridge University Press. 465-570
Dickson A G. 1990. Standard potential of the reaction: AgCl(s)+1/2H2(g) =Ag(s)+HCl(aq), and and the standard acidity constant of the ion HSO「 in synthetic sea water from 273.15 to 318.15 K. J Chem Thermodyn, 22: 113-127
Doney S C, Fabry V J, Feely R A, Kleypas J A. 2009. Ocean acidification: The other CO2 problem. Annu Rev Mar Sci, 1: 169-192
Duarte C M, Hendriks I E, Moore T S, Olsen Y S, Steckbauer A, Ramajo L, Carstensen J, Trotter J A, McCulloch M. 2013. Is ocean acidification an open ocean syndrome? Understanding anthropogenic impacts on seawater pH. Estuar Coast, 36: 221-236
Ekstrom J A, Suatoni L, Cooley S R, Pendleton L H, Waldbusser G G, Cinner J E, Ritter J, Langdon C, van Hooidonk R, Gledhill D, Wellman K, Beck M W, Brander L M, Rittschof D, Doherty C, Edwards P E T, Portela R. 2015. Vulnerability and adaptation of US shellfisheries to ocean acidification. Nat Clim Change, 5: 207-214
Feely R A, Alin S R, Newton J, Sabine C L, Warner M, Devol A, Krembs
http://engine.scichina.com/doi/10.1007/s11430-017-9151-4
C, Maloy C. 2010. The combined effects of ocean acidification, mixing, and respiration on pH and carbonate saturation in an urbanized estuary. Estuar Coast Shelf Sci, 88: 442-449
Feely R A, Sabine C L, Byrne R H, Millero F J, Dickson A G, Wanninkhof R, Murata A, Miller L A, Greeley D. 2012. Decadal changes in the aragonite and calcite saturation state of the Pacific Ocean. Glob Bio- geochem Cycle, 26: GB3001
Garilli V, Rodolfo-Metalpa R, Scuderi D, Brusca L, Parrinello D, Rastrick S P S, Foggo A, Twitchett R J, Hall-Spencer J M, Milazzo M. 2015. Physiological advantages of dwarfing in surviving extinctions in high- CO2 oceans. Nat Clim Change, 5: 678-682
Gruber N, Hauri C, Lachkar Z, Loher D, Frolicher T L, Plattner G K. 2012. Rapid progression of ocean acidification in the California current system. Science, 337: 220-223
He X, Bai Y, Pan D, Chen C T A, Cheng Q, Wang D, Gong F. 2013. Satellite views of the seasonal and interannual variability of phytoplankton blooms in the eastern China seas over the past 14 yr (19982011). Biogeosciences, 10: 4721-4739
Huang W J, Wang Y C, Cai W J. 2012. Assessment of sample storage techniques for total alkalinity and dissolved inorganic carbon in seawater. Limnol Oceanogr-Methods, 10: 711-717
Jin P, Wang T F, Liu N N, Dupont S, Beardall J, Boyd P W, Riebesell U, Gao K S. 2015. Ocean acidification increases the accumulation of toxic phenolic compounds across trophic levels. Nat Commun, 6: 8714
Jin S F, Wang Y L, Xia J J, Xiao N, Zhang J L, Xiong Z. 2015. Decline in the species richness contribution of Echinodermata to the macrobenthos in the shelf seas of China. Phys Chem Earth, 87-88: 43-49
Lewis E, Wallace D W R. 1998. Program developed for CO2 system calculations, ORNL/CDIAC-105. Carbon Dioxide Information Analysis Center, Oak Ridge National Laboratory, US Department of Energy, Oak Ridge, Tennessee
Liu X S, Fan Y, Shi S J, Hua E, Zhang Z N. 2014. Studies on the species composition and community structure of macrofauna in the Bohai Sea, China (in Chinese). Acta Oceanol Sin, 36: 53-66
Liu W G, He M X. 2012. Effects of ocean acidification on the metabolic rates of three species of bivalve from southern coast of China. Chin J Ocean Limnol, 30: 206-211
Melzner F, Thomsen J, Koeve W, Oschlies A, Gutowska M A, Bange H W, Hansen H P, Kortzinger A. 2013. Future ocean acidification will be amplified by hypoxia in coastal habitats. Mar Biol, 160: 1875-1888
Millero F J. 1979. The thermodynamics of the carbonate system in seawater. Geochim Cosmochim Acta, 43: 1651-1661
Millero F J, Graham T B, Huang F, Bustos-Serrano H, Pierrot D. 2006. Dissociation constants of carbonic acid in seawater as a function of salinity and temperature. Mar Chem, 100: 80-94
Mucci A. 1983. The solubility of calcite and aragonite in seawater at various salinities, temperatures, and one atmosphere total pressure. Am J Sci, 283: 780-799
Orr J C, Fabry V J, Aumont O, Bopp L, Doney S C, Feely R A, Gnana- desikan A, Gruber N, Ishida A, Joos F, Key R M, Lindsay K, Maier- Reimer E, Matear R, Monfray P, Mouchet A, Najjar R G, Plattner G K, Rodgers K B, Sabine C L, Sarmiento J L, Schlitzer R, Slater R D, Totterdell I J, Weirig M F, Yamanaka Y, Yool A. 2005. Anthropogenic ocean acidification over the twenty-first century and its impact on calcifying organisms. Nature, 437: 681-686
Pelletier G J, Lewis E, Wallace DWR. 2015. CO2SYS.XLS: A calculator for the CO2 system in seawater for Microsoft Excel/VBA (Version 24). Washington State Department of Ecology, Olympia, Washington. http:// www.ecy.wa.gov/programs/eap/models.html
Sabine C L, Feely R A, Gruber N, Key R M, Lee K, Bullister J L, Wan- ninkhof R, Wong C S, Wallace D W R, Tilbrook B, Millero F J, Peng T H, Kozyr A, Ono T, Rios A F. 2004. The oceanic sink for anthropogenic CO2. Science, 305: 367-371
Shi J H, Gao H W, Zhang J, Tan S C, Ren J L, Liu C G, Liu Y, Yao X. 2012. Examination of causative link between a spring bloom and dry/ wet deposition of Asian dust in the Yellow Sea, China. J Geophys Res, 117: D17304
State Oceanic Administration of China. 2013. Bulletin of Marine Environmental Status of China in 2012 (in Chinese). Available at: http:// www.mlr.gov.cn/zwgk/tjxx/201311/t20131128_1294239.htm
Tan S C, Wang H. 2014. The transport and deposition of dust and its impact on phytoplankton growth in the Yellow Sea. Atmos Environ, 99: 491- 499
Waldbusser G G, Hales B, Langdon C J, Haley B A, Schrader P, Brunner E L, Gray M W, Miller C A, Gimenez I. 2015. Saturation-state sensitivity of marine bivalve larvae to ocean acidification. Nat Clim Change, 5: 273-280
Wong G T F. 2012. Removal of nitrite interference in the Winkler determination of dissolved oxygen in seawater. Mar Chem, 130-131: 28- 32
Xu X M, Zang K P, Huo C, Zheng N, Zhao H D, Wang J Y, Sun B. 2016. Aragonite saturation state and dynamic mechanism in the southern Yellow Sea, China. Mar Pollut Bull, 109: 142-150
Xu X M, Zhai W D, Wu J H. 2013. Effects of CO2-driven ocean acidification on the calcification and respiration of Ruditapes philippinarum (in Chinese). Acta Oceanol Sin, 35: 112-120
Yamamoto S, Kayanne H, Terai M, Watanabe A, Kato K, Negishi A, Nozaki K. 2012. Threshold of carbonate saturation state determined by CO2 control experiment. Biogeosciences, 9: 1441-1450
Yuan X, Shao S, Dupont S, Meng L, Liu Y, Wang L. 2015. Impact of CO2- driven acidification on the development of the sea cucumber Aposti- chopus japonicus (Selenka) (Echinodermata: Holothuroidea). Mar Pollut Bull, 95: 195-199
Yuan X, Shao S, Yang X, Yang D, Xu Q, Zong H, Liu S. 2016. Bioenergetic trade-offs in the sea cucumber Apostichopus japonicus (Echinodermata: Holothuroidea) in response to CO2-driven ocean acidification. Environ Sci Pollut Res, 23: 8453-8461
Zang J, Tang Y, Zou E, Lie H J. 2003. Analysis of Yellow Sea circulation. Chin Sci Bull, 48: 12-20
Zhai W D, Zhao H D. 2016. Quantifying air-sea re-equilibration-implied ocean surface CO2 accumulation against recent atmospheric CO2 rise. J Oceanogr, 72: 651-659
Zhai W D, Zhao H D, Zheng N, Xu Y. 2012. Coastal acidification in summer bottom oxygen-depleted waters in northwestern-northern Bohai Sea from June to August in 2011. Chin Sci Bull, 57: 1062-1068
Zhai W D, Zheng N, Huo C, Xu Y, Zhao H D, Li Y W, Zang K P, Wang J Y, Xu X M. 2014. Subsurface pH and carbonate saturation state of aragonite on the Chinese side of the North Yellow Sea: Seasonal variations and controls. Biogeosciences, 11: 1103-1123
Zhang J. 1994. Atmospheric wet deposition of nutrient elements: Correlation with harmful biological blooms in Northwest Pacific coastal zones. Ambio, 23: 464-468
(Responsible editor: Kefu YU)