

Differential physiological responses of the coastal cyanobacterium Synechococcus sp. PCC7002 to elevated pCO2 at lag, exponential, and stationary growth phases
Shanli MOU1, Gang LI1,2, Hongmei LI1, Fazhong LI3, Zhisheng SHAO3, Jinsong LI3,
Changfeng QU4 & Yongyu ZHANG1[ Corresponding author (email: zhangyy@qibebt.ac.cn)
Science China Press and Springer-Verlag GmbH Germany, part of Springer]
1 Key Laboratory of Biofuels, Shandong Provincial Key Laboratory of Energy Genetics, Qingdao Institute of Bioenergy and Bioprocess
Technology, Chinese Academy of Sciences, Qingdao 266101, China;
2 Key Laboratory of Tropical Marine Bio-resources and Ecology, South China Sea Institute of Oceanology, Chinese Academy of Sciences,
Guangzhou 510301, China;
3 Zhanjiang Branch of China National Offshore Oil Corporation Ltd., ZhanjiaHg 524000, China;
4 Key Laboratory of Marine Bioactive Substance, the First Institute of Oceanography, State Oceanic Administration, Qingdao 266061, China
Received November 12, 2017; revised January 25, 2018; accepted April 24, 2018; published online May 24, 2018
Abstract
We studied the effects of expected end-of-the-century pCO2 (1000 ppm) on the photosynthetic performance of a coastal marine cyanobacterium Synechococcus sp. PCC7002 during the lag, exponential, and stationary growth phases. Elevated pCO2 significantly stimulated growth, and enhanced the maximum cell density during the stationary phase. Under ambientpCO2 conditions, the lag phase lasted for 6 days, while elevatedpCO2 shortened the lag phase to two days and extended the exponential phase by four days. The elevatedpCO2 increased photosynthesis levels during the lag and exponential phases, but reduced them during the stationary phase. Moreover, the elevated pCO2 reduced the saturated growth light (Ik) and increased the light utilization efficiency (a) during the exponential and stationary phases, and elevated the phycobilisome:chlorophyll a (Chl a) ratio. Furthermore, the elevated pCO2 reduced the particulate organic carbon (POC):Chl a and particulate organic nitrogen (PON):Chl a ratios during the lag and stationary phases, but enhanced them during the exponential phase. Overall, Synechococcus showed differential physiological responses to elevatedpCO2 during different growth phases, thus providing insight into previous studies that focused on only the exponential phase, which may have biased the results relative to the effects of elevated pCO2 in ecology or aquaculture.
Keywords:Elevated pCO2, Lag, Exponential and stationary phases, Photosynthetic performance, Synechococcus
Citation: Mou S, Li G, Li H, Li F, Shao Z, Li J, Qu C, Zhang Y. 2018. Differential physiological responses of the coastal cyanobacterium Synechococcus sp. PCC7002 to elevatedpCO2 at lag, exponential, and stationary growth phases. Science China Earth Sciences, 61: 1397-1405, https://doi.org/10.1007/ S11430-017-9206-5
1. Introduction
Atmospheric CO2 concentration has increased from 285 ppm in preindustrial times (Indermuhle et al., 1999) to 407 ppm in 2017 (https://www.co2.earth/), and will approach ~1000 ppm by 2100 (Gattuso et al., 2015). Increasing atmospheric CO2 has become one of the major environmental issues in the 21st century (Harley, 2011; Kroeker et al., 2013). CO2 is a major requirement for algal photosynthesis (Gao et al., 2012), and the rising CO2 levels have been thoroughly determined to affect the physiology of marine algae, including planktonic algae (Lomas et al., 2012; Xu etal., 2014; Li et al., 2017), coralline algae (Gao et al., 1993; McCoy and Kamenos, 2015; Nash et al., 2016), and others. Previous results show that the impact of elevated CO2 on algal physiological activity is diverse, ranging from enhanced photosynthesis (Suarez-Alvarez et al., 2012; Olis- chlager and Wiencke, 2013), growth (Olischlager et al., 2013) and nutrient uptake (Qu et al., 2017); reduced growth rates (Gao and Zheng, 2010); or neutral effects (Flynn et al., 2015; Gao and Campbell, 2014). Studies also show that elevated CO2 increases the sensitivity of photosystem II (PSII) photoinactivation to high lights (Li and Campbell, 2013), and even alters the planktonic algae community due to their species-specific responses to elevated partial pressure of CO2 (pCO2) (Yoshimura et al., 2009; Reinfelder, 2011;Wulffetal., 2016).
Coastal waters are undergoing greater variations in physical and chemical environments than are the pelagic oceans due to increasing human activities (Drupp et al., 2011). Coastal environmental factors, especially CO2 concentration, are highly dynamic (Wootton et al., 2008), affecting the physiological activities of the phytoplankton therein. Existing studies indicate that the capacity of coastal microalgae to cope with dynamic pCO2 differs greatly as compared to that of oceanic microalgae (Li et al., 2016). However, this conclusion is primarily based on studies of eukaryotic species, and few studies have been performed on prokaryotic species, especially cyanobacteria, which are ubiquitously distributed in the world's oceans and are recognized as major components of marine phytoplankton assemblies (Flombaum et al., 2013). These unicellular microorganisms play a key role in marine ecosystems, and are responsible for about 25% of the global organic carbon fixation (Chiu et al., 2014; Axmann et al., 2014). Synechococcus, an important group of cyanobacteria, are one of the main drivers of the marine biological carbon pump (Dufresne et al., 2008). At present, most studies on Synechococcus have focused on ecological investigations regarding their abundance and distribution, as well as their relationships to temperature, light, and nutrients (Partensky et al., 1999; Moisan et al., 2010; Flombaum et al., 2013). Some laboratory studies of Synechococcus also considered their photosynthetic responses to increased pCO2, but these studies primarily used oceanic species (Fu et al., 2007; Traving et al., 2014). Therefore, much less is currently known about the photosynthetic responses to elevated CO2 by coastal Synechococcus.
The strain Synechococcus sp. PCC7002 is mainly found in coastal and estuarine waters, where it is subject to fluctuating pCO2 (Woodger et al., 2007). To date, there are only a few studies that focused on the effects of elevated pCO2 on the physiological performance of this strain (Onizuka et al., 2002; Mou et al., 2017). For example, results from Mou et al. (2017) show that elevatedpCO2 interacts with N limitation to decrease the cellular chlorophyll a (Chl a) content and the C: N ratio of Synechococcus, and the elevated pCO2 decreases the gene expression and activity of chloramphenicol acetyltransferase (CAT) (Onizuka et al., 2002). However, these studies all used Synechococcus cells from the exponential growth phase, and failed to consider that cells naturally in the lag, exponential, or stationary phases may respond differently to elevated pCO2, thus limiting our full understanding regarding the effects of elevated pCO2 on photosynthetic physiology. Therefore, in this study we examined the effects of elevated pCO2 on photosynthetic performance, inorganic nutrient uptake, and the cellular carbon and nitrogen content of Synechococcus sp. PCC7002 during the lag, exponential, and stationary growth phases.
2.Materials and methods
2.1Culture protocol
A coastal cyanobacterium strain Synechococcus sp. PCC7002, supplied by Prof. Xuefeng Lu of the Qingdao Institute of Bioenergy and Bioprocess Technology, Chinese Academy of Sciences, was axenically cultured in 800 mL flasks with A+ medium (12 mM NO3-N and 0.37 mM PO43" P), at 25 C and 40 卩mol photons m-2 s-1 growth light with a light:dark(L:D) cycle of12:12 h. The temperature of25 C is the optimal temperature for this strain, and the light density was close to its light-saturated point. Cells in the logarithmic growth phase were inoculated into fresh medium, which was pre-bubbled to ambient CO2 levels (400 ppm), or elevated CO2 levels (1000 ppm) in an incubator. The cultures were bubbled with CO2 at a constant flow rate of30 mL min-1. The elevated CO2 was achieved using a CO2 enrichment device (CE100D-3; Ruihua Instrument & Equipment Co. Ltd, China). The elevated pCO2 of 1000 ppm is projected as the atmospheric CO2 levels in 2100 (IPCC 2011).
2.2Growth and pigment determination
Growth of the cultures was monitored by tracking the changes in Chl a concentration and light absorbance for 22 days. Every two days, samples were collected and evaluated as described below. Ten milliliter cultures from each treatment were filtered using a cellulose acetate membrane (pore size, 0.22 pm) and stored at -20 C until analysis. The filters with the attached cells were then thawed and extracted overnight with 10 mL of 90% acetone at 4 C in darkness. After 10 min centrifugation (5000 g), the absorbance of the supernatant was measured using a spectrophotometer (Lambda 25, PerkinElmer, USA). Chl a and carotenoid (Carot) content were calculated using the following equations of Arnon (1949) and Wellburn (1994), respectively:
Chl ^=12.7x(A663-A750)-2.69x(A645- A750), (1 )
Carot=2.1 lx(A663-A750)-10.01x(A645-A750)
+4.37x(A470-A750). (2)
To obtain the culture absorption, 3 mL aliquots of culture from each pCO2 treatment was dispensed into a cuvette at each time-point mentioned above, and measured using a spectrophotometer (Lambda 25, PerkinElmer, USA). The absorbance at the wavelengths of750, 680, and 630 nm were measured in order to track the changes in cell density, and the Chl a and phycobilisome content. We used the ratios of (A680-A750)/A750 and (A630-A750)/(A680-A750) to approximate the cellular Chl a content and the ratio of phycobilisomes to Chl a, respectively (Fraser et al., 2013).
2.3Chlorophyll fluorescence measurement
To measure chlorophyll fluorescence, 5 mL aliquots from each pCO2 treatment was placed in triplicate into 5 mm quartz cuvettes and the fluorescence measured using a dualwavelength pulse amplitude modulated fluorescence monitoring system (Dual-PAM, Heinz Walz, Germany) at the growth temperature (25 C). Prior to taking the measurements, the cells grown in the different CO2 conditions were dark adapted for 15 min. The minimum fluorescence was then determined under low measuring light, followed by a pulse of saturating light (10000 卩mol photon m-2 s-1 for 300 ms) to obtain the maximum fluorescence (Fm). Once steady state fluorescence was achieved, the saturating pulses were applied every 30 s to measure the maximum fluorescence under actinic light (Fm'). The PSII photochemical quantum yield (Fv/Fm) was calculated as Fv/Fm=(Fm-F〃 Fm (Mackey et al., 2013). The rapid light curves (RLCs) were measured following 30 s exposure of actinic light at 6, 13, 22, 53, 95, 126, 216, 339, 531, and 825 卩mol photon m-2 s-1. The parameters identified from RLCs, including the light harvesting efficiency (a), maximum relative electron transport rate (rETRmax), and saturated light intensity (Ik), were determined from a double exponential function (Platt et al., 1980) and calculated using Dual-PAM-100 software.
2.4Nitrate and phosphonate measurements
Every 2 days, a 10 mL aliquot of the cultures was filtered through cellulose acetate membrane (pore size, 0.45 pm) and the filtrate frozen in brown glass flasks and stored at -20 C until analysis. The frozen filtrate was then thawed at room temperature, and the nitrate (NO3-) and phosphorous (PO43-) concentrations measured by spectrophotometry (Lambda 25, PerkinElmer, USA) according to Norman et al. (1985), and Murphy and Riley (1962), with the analytical precision of NO3- and PO43- being 0.04 and 0.02 卩M, respectively.
2.5Carbon and nitrogen measurements
To determine the cellular particulate organic carbon (POC) and nitrogen (PON) levels, duplicate 20 mL cultures from ambient and elevated pCO2 conditions were filtered onto precombusted (450 C, 6 h) Whatman GF/F glass fiber filters (pore size, 0.7 pm). The filters were frozen and stored at -20 C until analysis. Prior to analysis, the filters were exposed to HCl fumes overnight to remove the inorganic carbon, and then dried for 6 h at 60 C. Cellular POC and PON were measured using a Vario EL III automatic elemental analyzer (Elementar Analysensysteme Co., Germany). The samples for cellular POC and PON measurements were taken at lag, exponential and stationary growth stages, separately at day 2, 18 and 22 and day 2, 12 and 22 under ambient and elevated pCO2 conditions, respectively.
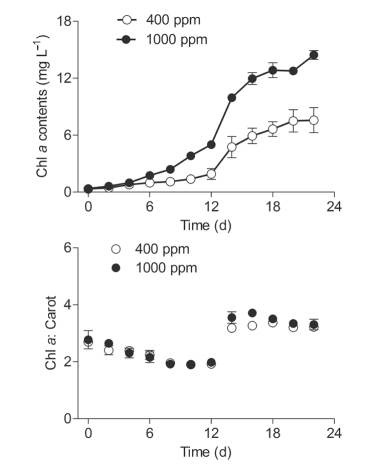
Figure 1 Temporal changes of (a) chlorophyll a (Chl a; mg L-1) biomass and (b) Chl a to carotenoids ratio (Chl a:Carot) of Synechococcus sp. PCC7002 grown under ambient (400 ppm) and elevated (1000 ppm) pCO2 conditions. Vertical bars indicate the standard deviations (n=3).
To determine the levels of dissolved organic carbon (DOC), the filtrates, as described above, were evaluated with a total organic carbon analyzer (TOC-VCSH; Shimadzu, Nakagyo-ku, Kyoto, Japan). Each DOC measurement was performed in triplicate. Prior to the DOC collection and analysis, all the glassware and plasticware were soaked overnight in 10% HCl, intensively rinsed with Milli-Q water, and combusted at 450 C for 5 h. The A+ medium used for culturing the Synechococcus included sufficient Tris, EDTA, and Vitamin B12, and generated approximately 400.2 mg DOC L-1. The cell-excreted DOC levels were calculated by subtracting this background value of DOC.
2.6Statistical analysis
Mean values and standard deviations are presented in the figures. One-way Analysis of Variance (ANOVA) and paired /-test were used to analyze the data with p value of <0.05 considered statistical significant.
3.Results and discussion
The growth of Synechococcus sp. PCC7002 in cultures under ambient (400 ppm) and elevated (1000 ppm) pCO2 conditions was tracked using the Chl a biomass (Figure 1a). Under ambient pCO2, the Chl a biomass gradually increased from 0.34 mg L-1 to 0.78 mg L-1 during the first four days, sharply increased to 6.64 mg L-1 on day 18, and then plateaued (7.57 mg L-1) during the final four days. Within the first four days, the cultures grown in elevated pCO2 demonstrated no significant difference in Chl a biomass as compared to cultures grown in ambient pCO2. However, the elevated pCO2 significantly induced an increase in Chl a biomass from Day six onward, with the biomass being enhanced by 90.7% on day 22 (Figure 1a), indicating that the elevated pCO2 posi-values derived from ln(A680-A750), which indicated the concentration of Chl a, showed no significant difference with that from cell density in either ambient or elevated pCO2 conditions (Figure 2a and 2b). Cyanobacteria are often subjected to significant carbon restriction owing to the low CO2 availability in normal conditions (Badger and Price, 2003). To obtain additional carbon sources, CO2-con- centrating mechanisms (CCMs) are involved, which have multiple inorganic carbon transport systems used for the active uptake of both CO2 and HCO3- in S^ynechococcus sp. PCC7002 (Badger and Price, 2003; Woodger et al., 2007). The higher growth rate under elevated pCO2 may be induced by downregulating the CCMs, and the increased CO2 availability (Gao et al., 1991). The elevatedpCO2, which supplies algae more free CO2, may also save the cells energy to maintain growth, compared to energy obtained from using other carbon sources such as HCO3- (Li et al., 2012; Hop- kinson et al., 2011). This type of resource saving may also be used for other physiological processes, ultimately benefitting their growth, or accelerating the acclimation to environmental pressure. Moreover, increased dissolved CO2 may cause changes to the carbonate chemistry in cultures, which might induce changes to the pH of the environment and affect the growth of algae (Gao et al., 1991; Hong et al., 2017).
Unfortunately, no pH values were available in this study.tively impacted the maximum cell density. Generally, a limitation of inorganic carbon occurs when high cell density is reached in culture system under ambient conditions (Li et al., 2012). In the current study, elevated pCO2 may have supplied surplus carbon sources and thus maintained the high cell density (Figure 1a). The ratio of Chl a to carotenoids (Chl a: Carot) sharply increased from Day 14 to Day 22 under both the ambient and elevated CO2 conditions (Figure 1b). In this case, the cells may have decreased their synthesis of energy-expensive carotenoids relative to the Chl a, thus leading to the higher Chl a: Carot ratio. Moreover, throughout the culturing period, no significant effect from the elevated pCO2 was detected on this ratio.
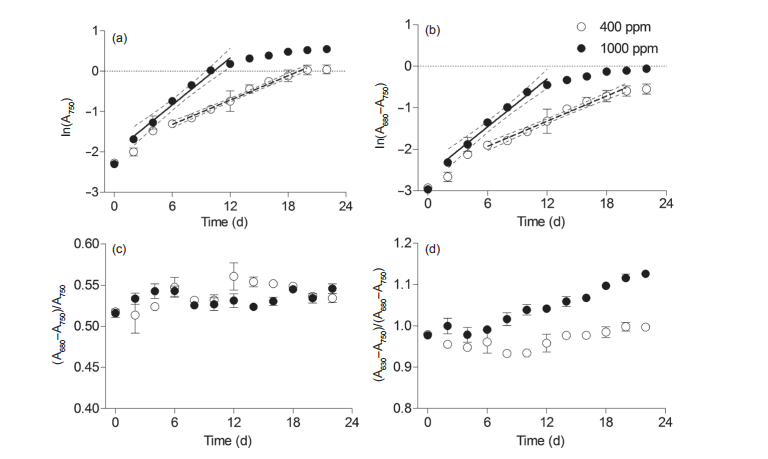
Figure 2 Temporal changes of (a) ln(A750), a proxy for culture cell suspension density, (b) ln(A680-A750), a proxy for Chl a density, (c) (A680-750)/ A750, a proxy cellular Chl a, and (d) (A630-750)/(A680-750), a proxy for phycobilisome to Chl a ratio in Synechococcus sp. PCC7002 under ambient (400 ppm) and elevated (1000 ppm) pCO2 growth conditions. Solid lines in panels A and B indicate linear regressions, and the dotted lines indicate the 95% confidence intervals. Vertical bars indicate the standard deviations (n=3).
To determine the exponential phase of Synechococcus culture, we established a line of best fit for ln(A750) against culturing time at a 95% confidence (Figure 2a and 2b). The time-periods before and after the best fit line were defined as the lag and stationary phases, respectively. Light absorption of A750, a proxy for cell density, showed that the exponential phase lasted from Day 6 to Day 20 under ambient pCO2 conditions (Figure 2a). Elevated CO2 concentrations shortened the lag phase to two days and the exponential phase to 12 days, and expanded the exponential phase by four days, which was consistent with the results for the Chl a biomass (Figure 1a). The growth rates (必)based on the ln (A750) were 0.11 0.02 and 0.19 0.05 under ambient and elevated pCO2 conditions, respectively. Moreover, the 卩
The mean level of Chl a per cell, indicated by (A680- A750)/A750, showed no significant temporal variations under either ambient or elevated pCO2 growth conditions (Figure 2c), which is consistent with our previous results (Mou et al., 2017). The cellular Chl a levels might be underestimated since the self-shading indicated by the tremendous increase of Chl a concentration may have decreased the light absorbance (Owens and Wold, 1986), although it had limited effect on the evaluation of the Chl a biomass variation. The relative ratio of phycobilisome to Chl a, in parallel with cellular Chl a content, significantly increased with culturing time, with six days of lag time occurring in both ambient and elevated pCO2 (Figure 2d). This ratio was significantly higher in elevated pCO2 than under ambient pCO2 conditions, indicating the promotion of elevated CO2 on cellular phycobilisome content. Increased light harvesting pigments would make cells capable of capturing more light energy for photosynthesis (Sidler, 1995; Gan and Bryant, 2015).
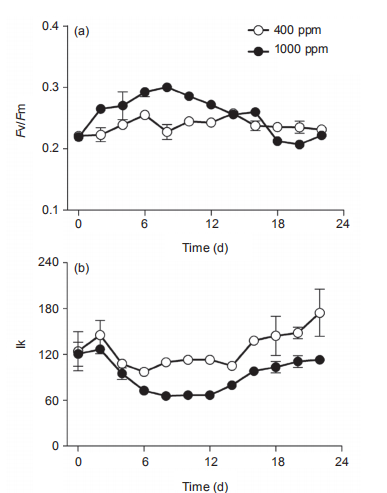
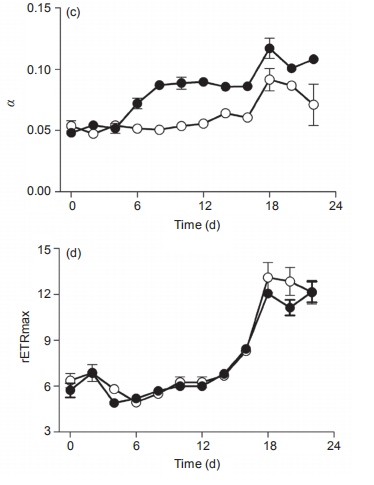
Figure 3 Temporal changes of (a) PSII maximum photochemical efficiency (Fv/Fm), (b) light harvesting efficiency ( ), (c) saturated light point(Ik), and (d) maximum relative electron transport rate (rETRmax) of Synechococcus sp. PCC7002 under ambient (400 ppm) and elevated(1000 ppm) pCO2 growth conditions. Vertical bars represent standard deviations (n=3).
In ambient pCO2 conditions, the PSII photochemical quantum yield (Fv/Fm) of the cultures was 0.23 0.01 and showed limited changes on a temporal scale (Figure 3a). In elevated pCO2 conditions, however, the Fv/Fm increased from 0.22 0.004 to 0.30 0.002 from Day 0 to Day 8, and decreased to 0.21 0.002 at Day 18, much lower than that in ambient pCO2 condition. Furthermore, the elevated pCO2 significantly induced the photosynthetic capacity during the period of Day 2 to Day 12 (p<0.05), consistent with the promotion of growth in Figure 2a and 2b, and as reported by others (Suarez-Alvarez et al., 2012; Olischlager and Wiencke, 2013). However, elevated pCO2 reduced the Fv/ Fm during Day 18 to Day 22, during the stationary phase (Figure 3a). The saturated light intensity (Ik) that was derived from RLCs varied from 97 2.3 to 147 25.6 卩mol photons m-2 s-1 under ambient pCO2, and showed no significant differences among the lag, exponential and stationary phases (Figure 3b). The elevated pCO2 significantly reduced the Ik, with a reduction of 27.2% and 37.4% during the exponential and stationary phases, respectively. The light harvesting efficiency (a) in ambient pCO2 was about 0.061 0.015 during the lag and exponential phases, but varied greatly during the stationary phase (Figure 3c). The impact of elevated pCO2 on a differed among the three different growth phases. For instance, it had limited effect during the lag phase, but significantly increased a during both the exponential (12%) and stationary (40.1%) phases (Figure 3c). Moreover, the temporal changes of a displayed an opposite trend as that of Ik under elevated pCO2 conditions (Figure 3b and 3c). The reduction of Ik and increase of a by elevated pCO2 was indicative of the elevated ratio of phycobilisome to Chl a (Figure 2d). Finally, the maximal relative electron transport rate (rETRmax) also differed greatly among the lag, exponential, and stationary growth phases, increasing from 6.0 0.82 to 6.6 1.0, to the maximum value of 12.7 0.49 during the stationary phase (Figure 3d). Again, elevated pCO2 showed no significant effect during any of the three growth phases. The increase of rETRmax during the study period showed a similar pattern as that for Chl a concentration (Figure 1a), indicating that self-shading may have affected the rETRmax by blocking the light energy received by the cells. The increase of Fv/Fm and a, and reduction of Ik by elevated pCO2 during the exponential phase also were consistent with the higher 卩(Figure 2a and 2b). In addition, the lowered Ik induced by elevated pCO2 would make the cells more sensitive to high lights (Chen et al., 2015).
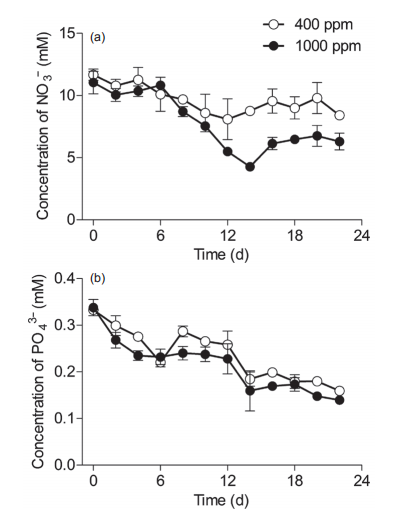
Figure 4 Temporal changes in the concentrations (mM) of macronutrients in the Synechococcus sp. PCC7002 cultures under ambient(400 ppm) and elevated (1000 ppm) pCO2 conditions. Vertical bars represent standard deviations (n=3).
To track the elevated pCO2-induced impact on macronutrient absorption, nitrate (NO3") and phosphorus (PO;-) concentrations were monitored throughout the experiments (Figure 4). In ambient pCO2 conditions, NO3- levels showed no significant differences among lag, exponential, and stationary phases (Figure 4a). Elevated pCO2 did not significantly affect the levels of NO3- during the lag phase, but did significantly reduce NO3- levels at the end of the exponential phase and during the stationary phase, indicating that the elevated pCO2 increased NO3- absorption in Sy- nechococcus cells (Figure 4a), and thus promoted their growth (Figure 2a and 2b). PO43- concentrations decreased throughout the experiments, and showed no significant effects from the elevated pCO2, although there were some scattered values lower than those in conditions of ambient pCO2 (Figure 4b).
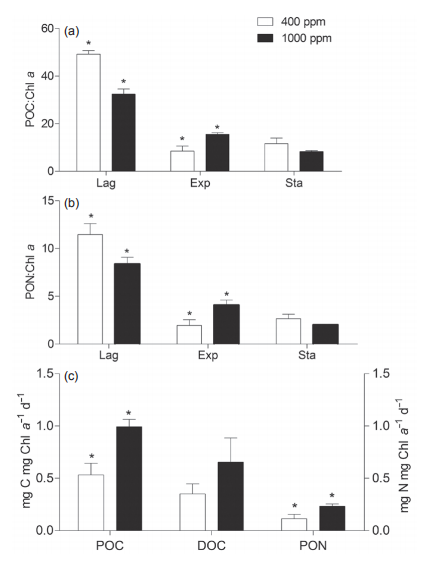
Figure 5 Ratios of particulate organic carbon (POC) and nitrogen (PON) to chlorophyll (Chl a) during lag, exponential, and stationary growth phases. Ratios are used to approximate the cellular C andN content. (c) The carbon and nitrogen assimilation rate during the exponential phase of Sy- nechococcus sp. PCC7002 culture under ambient (400 ppm) and elevated (1000 ppm) pCO2 conditions. The asterisks indicate significant difference (p<0.05) between ambient and elevated pCO2 conditions. Vertical bars represent standard deviations (n=3).
Particulate organic carbon (POC) and nitrogen (PON) during lag, exponential, and stationary phases are shown in Figure 5. Due to the unavailability of cell density data, the POC and PON levels were normalized to Chl a to approximate the cellular C and N contents (Figure 5a and 5b). Generally, both POC:Chl a and PON:Chl a ratios during the lag phase were higher than that of the exponential or stationary phases in either ambient or elevatedpCO2 conditions. Furthermore, elevated pCO2 reduced these ratios in lag and stationary phases, but increased them during the exponential phase (Figure 5a and 5b). Meanwhile, we normalized the assimilated POC and PON to Chl a during the exponential growth phase, and obtained the approximate C and N assimilation rates as shown in Figure 5c. Elevated pCO2 significantly promoted the C and N assimilation rate. The effects of elevated pCO2 on nutrient uptake have been extensively reported, but with inconsistent findings; positive (Qu et al., 2017), negative (Riebesell et al., 2000) or neutral (Riebesell et al., 2007; Xu et al., 2014). These contradictory results may be reconciled to some extent with the consideration of the differential responses of algae to elevated pCO2 at different growth stages (Figure 4). For example in the exponential phase, elevated pCO2 could drive cells to absorb more N (Figure 5c) and synthesize more organic matter to be stored in the cells or released into the environment (Gordillo et al., 1998). This is consistent with the decreased N in media (Figure 4). Such an impact by elevated pCO2 on N uptake also altered the N:C ratio within cells (Mou et al., 2017).
4.Conclusions
Effects of increasing atmospheric CO2 on algae physiological performance have been extensively studied, but most of these studies have focused on the effects of elevated pCO2 on eukaryotic algae, and almost all of them were performed with algae grown during the exponential phase (Li and Campbell, 2013; Li et al., 2016; McCarthy et al., 2012). Here, we showed the differential effects of elevated pCO2 on coastal prokaryotic algae Synechococcus sp. PCC7002 during the lag, exponential, and stationary growth phases. We found that elevated CO2 positively enhanced the growth, shortened the lag and exponential phases, and promoted maximal cell density of Synechococcus cells during the stationary phase. Moreover, the elevated pCO2 differentially affected Synechococcus photosynthetic performance, and altered its cellular carbon and nitrogen content during the lag, exponential, and stationary phases, indicating that different growth phases should be considered to better understanding the effects of elevated CO2 on algae in ecology or aquaculture.
Acknowledgements This work was supported by the National Key Research and Development Program of China (Grant No. 2016YFA0601402), the China SOA Grant Associated with Task (Grant No. GASI-03-01-02-05), the CNOOC Zhan^^iangBranch (GrantNo. CNOOC-KJ 125 FZDXM 00 ZJ 001-2014), the National Natural Science Foundation of China (Grant Nos. 41606092 & 41676156). This study is a contribution to the international IMBER project.
Arnon D I. 1949. Copper enzymes in isolated chloroplasts: Polyphenoloxidase in Beta vulgarsis. Plant Physiol, 24: 1-15
Axmann I M, Hertel S, Wiegard A, Dorrich A K, Wilde A. 2014. Diversity of KaiC-based timing systems in marine Cyanobacteria. Mar Genomics, 14: 3-16
Badger M R, Price G D. 2003. CO2 concentrating mechanisms in cyanobacteria: Molecular components, their diversity and evolution. J Exp Bot, 54: 609-622
Chen S, Gao K, Beardall J. 2015. Viral attack exacerbates the susceptibility of a bloom-forming alga to ocean acidification. Glob Change Biol, 21: 629-636
Chiu W, Dai W, Fu C, Raytcheva D, Flanagan J, Khant H A, LiuX, Rochat R H, Haase-Pettingell C, Piret J, Ludtke S J, Nagayama K, Schmid M F, King J A. 2014. Visualizing virus assembly intermediates inside marine cyanobacteria by zernike phase contrast electron cryo-tomography. Microsc Microanal, 20: 202-203
Drupp P, De Carlo E H, Mackenzie F T, Bienfang P, Sabine C L. 2011. Nutrient inputs, phytoplankton response, and CO2 variations in a semienclosed subtropical embayment, Kaneohe Bay, Hawaii. Aquat Geo- chem, 17: 473-498
Dufresne A, Ostrowski M, Scanlan D J, Garczarek L, Mazard S, Palenik B P, Paulsen I T, Tandeau de Marsac N, Wincker P, Dossat C, Ferriera S, Johnson J, Post A F, Hess W R, Partensky F. 2008. Unravelling the genomic mosaic of a ubiquitous genus of marine cyanobacteria. Genome Biol, 9: R90-16
Flombaum P, Gallegos J L, Gordillo R A, Rincon J, Zabala L L, Jiao N, Karl D M, Li W K W, Lomas M W, Veneziano D, Vera C S, Vrugt J A, Martiny A C. 2013. Present and future global distributions of the marine Cyanobacteria Prochlorococcus and Synechococcus. Proc Natl Acad Sci USA, 110: 9824-9829
Flynn K J, Clark D R, Mitra A, Fabian H, Hansen P J, Glibert P M, Wheeler G L, Stoecker D K, Blackford J C, Brownlee C. 2015. Ocean acidification with (de)eutrophication will alter future phytoplankton growth and succession. Proc R Soc B-Biol Sci, 282: 20142604
Fraser J M, Tulk S E, Jeans J A, Campbell D A, Bibby T S, Cockshutt A M. 2013. Photophysiological and photosynthetic complex changes during iron starvation in Synechocystis sp. PCC6803 and Synechococcus elongatus PCC7942. PLoS One, 8: e59861
Fu F X, Warner M E, Zhang Y, Feng Y, Hutchins D A. 2007. Effects of increased temperature and CO on photosynthesis, growth, and elemental ratios in marine Synechococcus and Prochlorococcus (cyanobacteria). J Phycology, 43: 485-496
Gan F, Bryant D A. 2015. Adaptive and acclimative responses of cyanobacteria to far-red light. Environ Microbiol, 17: 3450-3465
Gattuso J P, Magnan A, Bille R, Cheung W W, Howes EL, Joos F. 2015. Oceanography. contrasting futures for ocean and society from different anthropogenic CO2 emissions scenarios. Science, 349: aac4722
Gao K, Aruga Y, Asada K, Ishihara T, Akano T, Kiyohara M. 1993. Calcification in the articulated coralline alga Corallina pilulifera, with special reference to the effect of elevated CO2 concentration. Mar Biol, 117: 129-132
Gao K, Aruga Y, Asada K, Ishihara T, Akano T, Kiyohara M. 1991. Enhanced growth of the red algaPorphyra yezoensis Ueda in high CO2 concentrations. J Appl Phycol, 3: 355-362
Gao K, Campbell D A. 2014. Photophysiological responses of marine diatoms to elevated CO2 and decreased pH: A review. Funct Plant Biol,
41: 449-459
Gao K, Zheng Y. 2010. Combined effects of ocean acidification and solar UV radiation on photosynthesis, growth, pigmentation and calcification of the coralline alga Corallina sessilis (Rhodophyta). Glob Change Biol, 16: 2388-2398
Gao K S, Xu J T, Gao G, Li Y H, Hutchins D A. Huang B Q, Wang L, ZhengY, Jin P, Cai X N, Hader D -P,Li W, Xu K, Liu N N, Riebesell U. 2012. Rising CO2 and increased light exposure synergistically reduce marine primary productivity. Nat Clim Change, 2: 519-523
Gordillo F J L, Jimenez C, Figueroa F L, Niell F X. 1998. Effects of increased atmospheric CO2 and N supply on photosynthesis, growth and cell composition of the cyanobacterium Spirulina platensis (ar- throspira). J Appl Phycology, 10: 461-469
Harley C D G. 2011. Climate change, keystone predation and biodiversity loss. Science, 334: 1124-1127
Hong H, Shen R, Zhang F, Wen Z, Chang S, Lin W, Kranz S A, Luo Y W, Kao S J, Morel F M M, Shi D. 2017. The complex effects of ocean acidification on the prominent n2-fixing cyanobacterium. Science, 356: 527-531
Hopkinson B M, Dupont C L, Allen A E, Morel F M M. 2011. Efficiency of the CO2-concentrating mechanism of diatoms. Proc Natl Acad Sci USA, 108: 3830-3837
Indermuhle A, Stocker T F, Joos F, Fischer H, Smith H J, Wahlen M. 1999. Holocene carbon-cycle dynamics based on CO2 trapped in ice at Taylor Dome, Antarctica. Nature, 29: 605-609
IPCC. 2001. Climate change 2001: The scientific basis. Contribution of Working Group I to the Third Assessment Report of the Intergovernmental Panel on Climate Change. Cambridge and New York: Cambridge University Press. 881
Kroeker K J, Kordas R L, Crim R, Hendriks I E, Ramajo L, Singh G S, Duarte C M, Gattuso J P. 2013. Impacts of ocean acidification on marine organisms: Quantifying sensitivities and interaction with warming. Glob Change Biol, 19: 1884-1896
Li F, Beardall J, Collins S, Gao K. 2017. Decreased photosynthesis and growth with reduced respiration in the model diatom Phaeodactylum tricornutum grown under elevated CO2 over 1800 generations. Glob Change Biol, 23: 127-137
Li G, Campbell D A. 2013. Rising CO2 interacts with growth light and growth rate to alter Photosystem II photoinactivation of the coastal diatom Thalassiosira pseudonana. PLoS ONE, 8: e55562
Li W, Gao K, Beardall J. 2012. Interactive effects of ocean acidification and nitrogen-limitation on the diatom phaeodactylum tricornutum. PLoS ONE, 7: e51590
Li F T, Wu Y P, Hutchins D A, Fu F X, Gao K S. 2016. Physiological responses of coastal and oceanic diatoms to diurnal fluctuations in seawater carbonate chemistry under two CO2 concentrations. Biogeosciences, 13: 1-39
Lomas M, Hopkinson B, Losh J, Ryan D, Shi D, Xu Y, Morel F. 2012. Effect of ocean acidification on cyanobacteria in the subtropical North Atlantic. Aquat Microb Ecol, 66: 211-222
Mackey K R M, Paytan A, Caldeira K, Grossman A R, Moran D, McIlvin M, Saito M A. 2013. Effect of temperature on photosynthesis and growth in marine Synechococcus spp. Plant Physiol, 163: 815-829
McCarthy A, Rogers S P, Duffy S J, Campbell D A. 2012. Elevated carbon dioxide differentially alters the photophysiology of Thalassiosira pseudonana (bacillariophyceae) and Emiliania huxleyi (haptophyta). J Phycology, 48: 635-646
McCoy S J, Kamenos N A. 2015. Coralline algae (Rhodophyta) in a changing world: integrating ecological, physiological, and geochemical responses to global change. J Phycol, 51: 6-24
Moisan T A, Blattner K L, Makinen C P. 2010. Influences of temperature and nutrients on Synechococcus abundance and biomass in the southern Mid-Atlantic Bight. Cont Shelf Res, 30: 1275-1282
Mou S, Zhang Y, Li G, Li H, Liang Y, Tang L, Tao J, Xu J, Li J, Zhang C, Jiao N. 2017. Effects of elevated CO2 and nitrogen supply on the growth and photosynthetic physiology of a marine cyanobacterium, Synecho- coccus sp. PCC7002. J Appl Phycol, 29: 1755-1763
Murphy J, Riley J P. 1962. A modified single solution method for the determination of phosphate in natural waters. Anal Chim Acta, 27: 3136
Nash M C, Martin S, Gattuso J P. 2016. Mineralogical response of the mediterranean crustose coralline alga lithophyllum cabiochae to nearfuture ocean acidification and warming. Biogeosciences, 13: 59375945
Norman R J, Edberg J C, Stucki J W. 1985. Determination of nitrate in soil extracts by dual-wavelength ultraviolet spectrophotometry. Soil Sci Soc Am J, 49: 1182-1185
Olischlager M, Bartsch I, Gutow L, Wiencke C. 2013. Effects of ocean acidification on growth and physiology of Ulva lactuca (Chlorophyta) in a rockpool-scenario. Phycol Res, 61: 180-190
Olischlager M, Wiencke C. 2013. Ocean acidification alleviates low-temperature effects on growth and photosynthesis of the red alga Neosi- phonia harveyi (Rhodophyta). J Exp Bot, 64: 5587-5597
Onizuka T, Akiyama H, Endo S, Kanai S, Hirano M, Tanaka S, Miyasaka H. 2002. CO2 response element and corresponding trans-acting factor of the promoter for ribulose-1,5-bisphosphate carboxylase/oxygenase genes in Synechococcus sp. PCC7002 found by an improved electrophoretic mobility shift assay. Plant Cell Physiol, 43: 660-667
Owens T G, Wold E R. 1986. Light-harvesting function in the diatom phaeodactylum tricornutum i. isolation and characterization of pigmentprotein complexes. Plant Physiol, 80: 732
Partensky F, Blanchot J, Vaulot D. 1999. Differential distribution and ecology of Prochlorococcus and Synechococcus in oceanic waters: A review, in Marine Cyanobacteria, eds L. Charpy and A. Larkum (Monaco: Musee Oceanographique), 457-475
Platt T, Gallegos C L, Harrison W G. 1980. Photoinhibition of photosynthesis in natural assemblages of marine phytoplankton. J Mar Res, 38: 687-701
Qu C F, Liu F M, Zheng Z, Wang Y B, Li X G, Yuan H M, Li N, An M L, Wang X X, He Y Y, Li L L, Miao J L. 2017. Effects of ocean acidification on the physiological performance and carbon production of the Antarctic sea ice diatom Nitzschia sp. ICE-H. Mar Pollut Bull, 120: 184-191
Reinfelder J R. 2011. Carbon concentrating mechanisms in eukaryotic marine phytoplankton. Annu Rev Mar Sci, 3: 291-315
Riebesell U, Schulz K G, Bellerby RGJ, Botros M, Fritsche P, Meyerhofer M, Neill C, Nondal G, Oschlies A, Wohlers J, Zollner E. 2007. Enhanced biological carbon consumption in a high CO2 ocean. Nature, 450: 545-548
Riebesell U, Zondervan I, Rost B, Tortell P D, Zeebe R E, Morel F M M. 2000. Reduced calcification of marine plankton in response to increased atmospheric CO2. Nature, 407: 364-367
Sidler W A. 1995. The molecular biology of cyanobacteria. Photosynth Res, 45: 177-179
Suarez-Alvarez S, Gomez-Pinchetti J L, Garcia-Reina G. 2012. Effects of increased CO2 levels on growth, photosynthesis, ammonium uptake and cell composition in the macroalga Hypnea spinella (Gigartinales, Rhodophyta). J Appl Phycol, 24: 815-823
Traving S J, Clokie M R J, Middelboe M. 2014. Increased acidification has a profound effect on the interactions between the cyanobacterium Sy- nechococcus sp. WH7803 and its viruses. FEMS Microbiol Ecol, 87: 133-141
Wellburn A R. 1994. The spectral determination of chlorophylls a and b, as well as total carotenoids, using various solvents with spectrophotometers of different resolution. J Plant Physiol, 144: 307-313
Woodger F J, Bryant D A, Price G D. 2007. Transcriptional regulation of the CO2-concentrating mechanism in a euryhaline, coastal marine cyanobacterium, Synechococcus sp. strain PCC7002: Role of NdhR/ CcmR. J Bacteriol, 189: 3335
Wootton J T, Pfister C A, Forester J D. 2008. Dynamic patterns and ecological impacts of declining ocean pH in a high-resolution multi-year dataset. Proc Natl Acad Sci USA, 105: 18848-18853
Wulff A, Karlberg M, Olofsson M, Torstensson A, Riemann L, Steinhoff F. 2016. Climate-driven change in a Baltic Sea summer microplanktonic
October (2018) Vol.61 No.10
algae Chlamydomonas sp. ICE-L. Environ Sci Technol, 48: 7738-7746 Yoshimura T, Nishioka J, Suzuki K, Hattori H. 2009. Impacts of elevated
CO2 on phytoplankton community composition and organic carbon dynamics in nutrient-depleted Okhotsk Sea surface waters. J Exp Mar Biol Ecol, 6: 205-216
(Responsible editor: Rui ZHANG)