

Regeneration and utilization of nutrients during collapse of a Mesodinium rubrum red tide and its influence on phytoplankton species composition
Yafeng ZHANG1, Xiuxian SONG2, Paul J. HARRISON3, Sheng LIU4, Zhiming YU2,Jinjun KAN5, Peiyuan QIAN6, Hao LIU1 & Kedong YIN1*
1 School of Marine Sciences, Sun Yat-Sen University, Guangzhou 510006, China; 2 Key Laboratory of Marine Ecology and Environmental Sciences, Institute of Oceanology, Chinese Academy of Sciences,
Qingdao 266071, China; 3 Department of Earth, Ocean & Atmospheric Sciences, University of British Columbia, Vancouver V6T 1Z4, Canada; 4 Key Laboratory of Tropical Marine Environmental Dynamics, South China Sea Institute of Oceanology, Chinese Academy of Sciences,
Guangzhou 510301, China; 5 Microbiology Division, Stroud Water Research Center, 970 Spencer Road, Avondale, PA 19311, USA; 6 Division of Life Science, Hong Kong University of Science and Technology, Clear Water Bay, NT, Hong Kong, China
Received October 31, 2017; revised April 12, 2018; accepted June 11, 2018; published online July 28, 2018
Abstract
High-biomass red tides occur frequently in some semi-enclosed bays of Hong Kong where ambient nutrients are not high enough to support such a high phytoplankton biomass. These high-biomass red tides release massive inorganic nutrients into local waters during their collapse. We hypothesized that the massive inorganic nutrients released from the collapse of red tides would fuel growth of other phytoplankton species. This could influence phytoplankton species composition. We tested the hypothesis using a red tide event caused by Mesodinium rubrum (M. rubrum) in a semi-enclosed bay, Port Shelter. The red tide patch had a cell density as high as 5.0x10⁵ cells L、,and high chlorophyll a (63.71 卩g L '). Ambient inorganic nutrients (nitrate: NO^, ammonium: NH+, phosphate: PO;二 silicate: SiO「)were low both in the red tide patch and the non-red-tide patch (clear waters outside the red tide patch). Nutrient addition experiments were conducted by adding all the inorganic nutrients to water samples from the two patches followed by incubation for 9 days. The results showed that the addition of inorganic nutrients did not sustain high M. rubrum cell density, which collapsed after day 1, and did not drive M. rubrum in the non-red-tide patch sample to the same high-cell density in the red tide patch sample. This confirmed that nutrients were not the driving factor for the formation of this red tide event, or for its collapse. The death of M. rubrum after day 1 released high concentrations of NO;, PO4-, SiO, NH+, and urea. Bacterial abundance and heterotrophic activity increased, reaching the highest on day 3 or 4, and decreased as cell density of M. rubrum declined. The released nutrients stimulated growth of diatoms, such as Chaetoceros affinis var. circinalis, Thalassiothrix frauenfeldii, and Nitzschia sp., particularly with additions of SiO3 treatments, and other species. These results demonstrated that initiation of M. rubrum red tides in the bay was not directly driven by nutrients. However, the massive inorganic nutrients released from the collapse of the red tide could induce a second bloom in low-ambient nutrient water, influencing phytoplankton species composition.
Keywords Red tides, Species composition, Nutrients, Regeneration, Mesodinium rubrum
1.Introduction
The marine ciliate Mesodinium rubrum (M. rubrum) is a red tide causative species in Hong Kong waters. The ciliate contains symbiotic photosynthetic cryptophytes and often forms coastal red tides (Crawford et al., 1997; Herfort et al., 2012; Yih et al., 2013). Because its extreme motility and phototactic behavior, M. rubrum can migrate vertically and aggregate in the surface and subsurface layers (Fenchel and Hansen, 2006; Dierssen et al., 2015; Jiang and Johnson, 2017) where turbulence is low and light is sufficient, exhibiting an extremely high rate of primary production (Crawford et al., 1997; Yih et al., 2013). Although M. rubrum is a nontoxic species, massive blooms can be potentially harmful to mariculture and coastal benthic ecosystems after their demise (Gustafson et al., 2000; Liu et al., 2011; Yih et al., 2013).
The collapse of high-biomass blooms and the subsequent decomposition of phytoplankton cells can regenerate massive amounts of nutrients in the localized red tide waters (Saba et al., 2011). For example, Noctiluca scintillans, the most frequently occurring red tide species in Hong Kong waters (Yin, 2003) has been shown to contain high internal concentrations of NH;, and to release NH;, especially after cell death (Huang and Qi, 1997). The regenerated nutrients could be used immediately by other phytoplankton, which may change species succession in local waters depending on temporal and spatial scales of the red tides. However, little attention has been paid to the effects of the collapse of blooms on nutrient cycles and their subsequent utilization by other phytoplankton.
Several 100 red tides have occurred in Hong Kong waters from 1983 to 2016, including the frequent red tides of M. rubrum (EPD, 2017). Port Shelter is a semi-enclosed bay in northeast Hong Kong where high-biomass red tides are observed to occur frequently in narrow bands along the local bathymetric isobars. However, the nutrients in the bay are too low to support high-biomass red tides (Yin et al., 2008). Previous studies showed physical aggregation and vertical migration of dinoflagellates appear to be the driving mechanism to promote the formation of red tides in this area (Yinet al., 2008; Lai and Yin, 2014). Those high-biomass red tides disappear quickly. We hypothesize that the collapse of high-biomass blooms would produce regenerated inorganic nutrients and fuel growth of other phytoplankton species, thus, influencing phytoplankton species composition.
To test this hypothesis, we collected water samples in the red tide patch and in surrounding waters outside the red tide patch during a red tide event caused by M. rubrum on 1 December 2000 in Port Shelter. We incubated the water samples without addition of nutrients and with additions of various nutrients, investigated the amount of nutrients released in water samples of the red patch, and examined whether the released nutrients were utilized by other phytoplankton species for growth.
2.Materials and methods
2.1Sampling
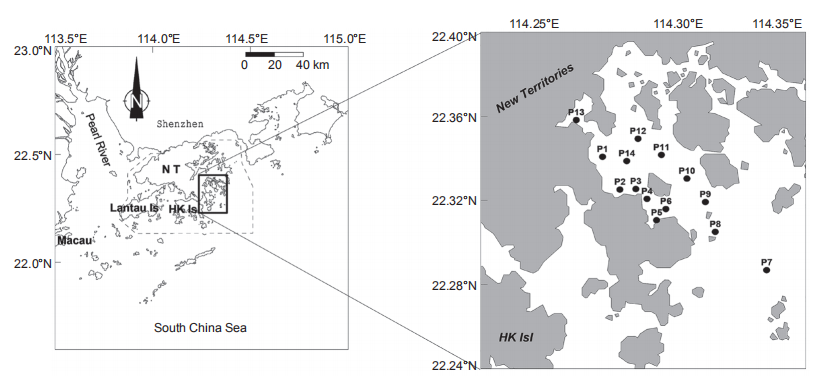
Porter Shelter is a semi-enclosed bay, located in the northeast of Hong Kong with water depths ranging from 4.8 to 22.8 m and its southern end opens into the northern South China Sea. The water quality is clean as it is mainly affected by offshore waters from the South China Sea during winter. A red tide of M. rubrum occurred on 30 November 2000 and we launched a one-day cruise to investigate the conditions of nutrients over the entire bay on 1 December 2000 (Figure 1). We investigated salinity and temperature profiles in the water column with a YSI? 6600 Water Quality Sonde. The water samples in the red tide patches were collected between P5 and P6. For chlorophyll a (chl a) measurement, a 100 mL sample of coloured water from the red tide patch and a 500 mL sample without colour at the other stations were filtered through Whatman GF/F filters (25 mm), and the filters were stored in the dark at -20 C. For nutrients, filtered water was stored at -20 C until measurements were carried out with a nutrient analyser in the laboratory within two weeks. Surface water samples inside and outside the red tide patches approximately 1 km away were placed in precleaned 20 L carboys and brought back to the laboratory for nutrient addition incubation experiments.
2.2Nutrient addition experiments
Nutrients including NO;, PO4-, SiO「,and trace metals, as well as vitamins were added to the water samples of the red tide patch and non-red-tide water (outside the red tide patch). There were 9 treatments: Control (one treatment without any nutrient additions) and 8 treatments with various nutrient additions: +N (NO3-;, with addition of NO;), +P (+PO;+), +Si (+S1O;), +NP (+NO3 +PO;), +NSi (+NO3 +SiOf), +PSi (+PO「+SiOf), +NPSi (+NO3 +PO「+SiOf), and +all (+NO3 +PO4- +SIO4- +trace metals +vitamins). The added final nutrient concentrations in the treatments were 150~200 卩mol L-1 for NO;, PO;, and SiO「. Samples were incubated in 2 L Nalgene transparent polycarbonate bottles in duplicate for each treatment and were placed in a water bath cooled with flowing tap water (similar to the sea surface temperature) on the top of a building for 9 days. The tanks were covered with one layer of neutral density screen to reduce the ambient light by ~50%. The in vi^vo fluorescence was monitored daily using a Turner Designs fluorometer. Samples for chl a, nutrients, phytoplankton species, and Figure 1 Map of the Port Shelter showing the study area and the sampling stations.bacterial abundance and production were taken daily during the incubation period.
2.3Sample analyses
Nitrates (plus nitrites), ammonium, phosphates, and silicates were determined by an autoanalyzer (Skalar San Plus) (Slawyk and Macisaac, 1972) and urea was analysed based on a modified method (Price and Harrison, 1987). Chl a filters were placed in 10 mL of 90% acetone and sonicated (in the dark) for 15 min in ice-cold water. After sonication, chl a was extracted in the cold and darkness for 24 h and analysed by in vitro fluorometry using a Turner Designs fluorometer (Knap et al., 1996).
Bacterial abundance was determined by using the DAPI direct count method. Samples fixed with formaldehyde were enumerated by epifluorescence microscopy (Porter and Feig, 1980). Bacterial production was estimated by 3H-[methyl]- thymidine incorporation (Amersham 85 Ci mmol-1) (Fuhrman and Azam, 1982). Subsamples in 20 mL clean plastic vials were placed in the dark at the in situ temperature and the reaction was stopped by adding formaldehyde and trichloroacetic acid. The killed samples were filtered through 0.2 pm cellulose nitrate filters. Filters were rinsed three times each with ice-cold 5% trichloroacetic acid and ice-cold 80% ethyl alcohol sequentially (Knap et al., 1996). Bacterial thymidine incorporation rate per cell (bacterial-specific growth rate) was calculated by dividing bacterial production by bacterial abundance.
2.4Calculations
The changes in nutrients and M. rubrum cell density during the same incubation period were used to quantitatively calculate the nutrient uptake or release concentration of the unit cell M. rubrum (Upt, or Rel)
UpR or Relx = (X「X )/( (1)
where X。and Xt are nutrient concentration at the beginning and the end of an incubation interval; C。and Ct are M. rubrum cell density at the beginning and the end of the incubation interval, respectively. The uptake of NO; and release of NH ; and urea during growth and demise of M. rubrum were calculated in the red tide patch.
The concentration of nitrogen assimilated by bacteria was calculated based on the element composition of bacterial cells. The bacterial atomic C:N ratios varied between 3.89.5:1 (Vrede et al., 2002). The value calculated by Chrza- nowski and Kyle (1996) was 7.6:1 and varied little with respect to growth rate or the element composition of the medium. Fukuda et al. (1998) measured the bacterial C:N ratio as 5.9 1.1 for coastal bacterial assemblages. In this study, we used 7C:1N as the bacterial C:N ratio and 20 fg as the bacterial cellular carbon content to calculate the concentration of nitrogen assimilated into the increased bacterial biomass on day 2 and day 4.
3.Results
3.1 Nutrients inside and outside the red tide patches
The surface salinity and temperature in Port Shelter displayed a slight horizontal gradient, ranging from 31.17 to 32.08, and ranging from 22.16 to 22.83 C (data not shown), respectively on 1 December 2000. In the red tide patch, chl a reached 63.71 pg L-1 with >80% of the chl a being in the >5 pm fraction and the cell density ofM. rubrum was as high as 5.0x10⁵ cells L-1. In contrast, surface chl a was much lower (<1.80 pg L-1) in the non-red-tide patch (Table 1). NO; (including NO;) concentration was 0.58 pmol L-1 in the red tide patch, significantly lower than that in the non- red-tide water, which ranged from 4.10~6.91 pmol L-1 (Table 1). The concentrations of NH;, P。:,and SiO「in the red tide patch (1.10, 0.45, and 20.60 pmol L-1) were also lower than those in the non-red-tide water (1.12~1.51, 0.45~0.76, and 20.61 ~23.84 pmol L-1). Urea in the red tide patch (0.46 pmol L-1) was significantly higher than that in the non-red-tide water (0.20-0.24 pmol L-1). Both the (NO ;+NO 2+NH ; )/PO:"(N/P) ratio and (NO;+NO; +NH;)/SiO「(N/Si) ratio in the non-red-tide water (9.8~15.5:1, 0.3~0.4:1, respectively) were higher than those in the red tide patch (4.8:1, <0.1:1, respectively) (Table 1).
3.2 Phytoplankton biomass during nutrient addition experiments
During the nutrient addition incubation, M. rubrum cell density in the red tide patch increased on day 1 but declined afterwards and almost disappeared by day 5. In the non-red- tide patch, the pattern was similar, with much lower cell density (Figure 2). Because M. rubrum dominated the phytoplankton assemblage, the in vi^vo fluorescence in the red tide patch followed the growth of M. rubrum (cell density), but not in the non-red-tide patch (Figure 3). In the red tide water samples, the in vivo fluorescence decreased during the next 3 days and was at a minimum on day 4 in all treatments. After 4-5 days, the in vivo fluorescence started to increase. The increase was the highest in the 3 treatments +NSi, +NPSi, and +all, which was mainly because of the increase in the diatoms and other phytoplankton species in the red tide samples (Figure 4). For example, the cell density of the dominant diatom species in the +Si only treatment was more than 1.5x10⁴ cells mL-1 on day 6. In contrast, in the non-red- tide patch, the in vivo fluorescence only increased in the treatments with N additions (Figure 3), indicating potential N limitation. This was consistent with the low initial ambient N/
P and N/Si ratios. The main species were Chaetoceros affinis var. circinalis, Thalassiothrix fraue^eldii, and Nitzschia sp.
3.3 Temporal changes in nutrients during incubation
3.3.1 Release and uptake of NH4+, urea, and NO3-
Nutrient addition experiments illustrated the dynamics of regeneration and uptake of nutrients during the incubation of the red tide samples. The initial NH; concentration was ~1 卩mol L-1 and increased rapidly in all the treatments, reaching a maximum in 4-6 days (Figure 5). In the Control and the treatments without N additions, the NH; concentration increased to ~30 卩mol L-1 on day 4. However, in the treatments with +N additions, NH; concentration increased to ~60 卩mol L-1. After 4-6 days, NH; concentrations decreased in all the treatments, to <3 卩mol L-1 in the treatments with Si additions, but to >20 卩mol L-1 without Si additions (Figure 5). Temporal changes in urea concentrations during the first 4 days were very similar to those of NH; in each treatment, increasing from <0.5 to 3~4 卩mol L-1 in the treatments without N additions and to 6~8 卩mol L-1 in the N addition treatments (Figure 6). Urea decreased in the treatments without N addition but only slightly decreased in those with N additions (Figure 6). In contrast, NH; concentrations in the non-red-tide samples were much lower and showed little variation during incubation (Figure 5); the response of urea was similar (Figure 6).
In the red tide samples, NO3-; decreased from ~150 to ~110 卩mol L-1 on day 1 and remained at ~110 卩mol L-1 during the entire incubation period in the +N, +NR and +NSi treatments, but decreased further to v80 卩mol L-1 by the end of incubation in the +NPSi and +all treatments (Figure 7). On the other hand, the initial NO; was low (2.5 卩mol L-1) in the Control and in the treatments without N additions (Figure 7). In the non-red-tide samples, NO; concentrations decreased from ~150 to ~120 卩mol L-1 during the first 4 days and remained unchanged in the +N, +NP and +NSi treatments, but NO; decreased continuously to~85 卩mol L-1 in the +NPSi and +all treatments (Figure 7).
During the first 4-day incubation in the red tide patch, M. rubrum dominated the phytoplankton assemblages. Therefore, we could use the changes of M. rubrum cell density as the indicator of the red tide stages. For two quantitative methods to compare NH; and urea during the growth and death of M. rubrum, the uptake of NO ; per M. rubrum cell (Upt(N0-)), and released concentration of NH ; and urea per M. rubrum cell (Rel (NH++urea)) during growth and death ofM. rubrum were calculated (Table 2). The Upt(N^) and Rel(NH:+urea)were much higher in the N addition treatments than the non-N addition treatments during the growth period. However, the differences in Rel(NH++urea)during the demise period between the N addition and non-N addition treatments in the red tide patch were much smaller. These changes suggested the uptake of NO; per M. rubrum cell varied with nutrient levels, but the release of NH; and urea per cell were similar under different nutrient conditions.
3.3.2 Uptake ofand PO^~ during incubation
In the red tide samples, the initial SiO「was ~20 卩mol L 1 and disappeared in the Control and treatments without Si additions by the end of the incubation (Figure 8). A similar amount of SiO「disappeared in the treatments with Si additions over the first 6 days and then SiO^- decreased rapidly regeneration and uptake of nutrients during the incubation of the red tide samples. The initial NH; concentration was ~1 卩mol L-1 and increased rapidly in all the treatments, reaching a maximum in 4-6 days (Figure 5). In the Control and the treatments without N additions, the NH; concentration increased to ~30 卩mol L-1 on day 4. However, in the treatments with +N additions, NH; concentration increased to ~60 卩mol L-1. After 4-6 days, NH; concentrations decreased in all the treatments, to <3 卩mol L-1 in the treatments with Si additions, but to >20 卩mol L-1 without Si additions (Figure 5). Temporal changes in urea concentrations during the first 4 days were very similar to those of NH; in each treatment, increasing from <0.5 to 3~4 卩mol L-1 in the treatments without N additions and to 6~8 卩mol L-1 in the N addition treatments (Figure 6). Urea decreased in the treatments without N addition but only slightly decreased in those with N additions (Figure 6). In contrast, NH; concentrations in the non-red-tide samples were much lower and showed little variation during incubation (Figure 5); the response of urea was similar (Figure 6).
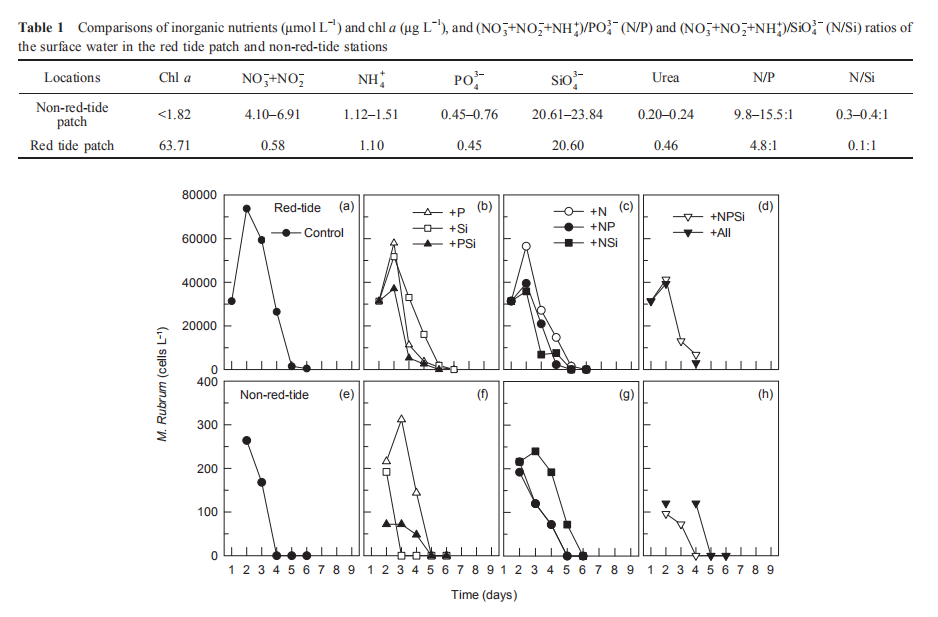
Figure 2 Time course of M. rubrum cell density for all treatments during incubation.
In the red tide samples, NO; decreased from ~150 to ~110 卩mol L-1 on day 1 and remained at ~110 卩mol L-1 during the entire incubation period in the +N, +NR and +NSi treatments, but decreased further to ~80 卩mol L-1 by the end of incubation in the +NPSi and +all treatments (Figure 7). On the other hand, the initial NO; was low (2.5 卩mol L-1) in the Control and in the treatments without N additions (Figure 7). In the non-red-tide samples, NO; concentrations decreased from ~150 to ~120 卩mol L-1 during the first 4 days and remained unchanged in the +N, +NP and +NSi treatments, but NO; decreased continuously to ~85 卩mol L-1 in the +NPSi and +all treatments (Figure 7).
During the first 4-day incubation in the red tide patch, M. rubrum dominated the phytoplankton assemblages. Therefore, we could use the changes of M. rubrum cell density as the indicator of the red tide stages. For two quantitative methods to compare NH; and urea during the growth and death of M. rubrum, the uptake of NO ; per M. rubrum cell (Upt(N0-)), and released concentration of NH ; and urea per M. rubrum cell (Rel (NH++urea)) during growth and death ofM. rubrum were calculated (Table 2). The Upt(N^) and Rel(NH:+urea)were much higher in the N addition treatments than the non-N addition treatments during the growth period. However, the differences in Rel(NH++urea)during the demise period between the N addition and non-N addition treatments in the red tide patch were much smaller. These changes suggested the uptake of NO; per M. rubrum cell varied with nutrient levels, but the release of NH; and urea per cell were similar under different nutrient conditions.
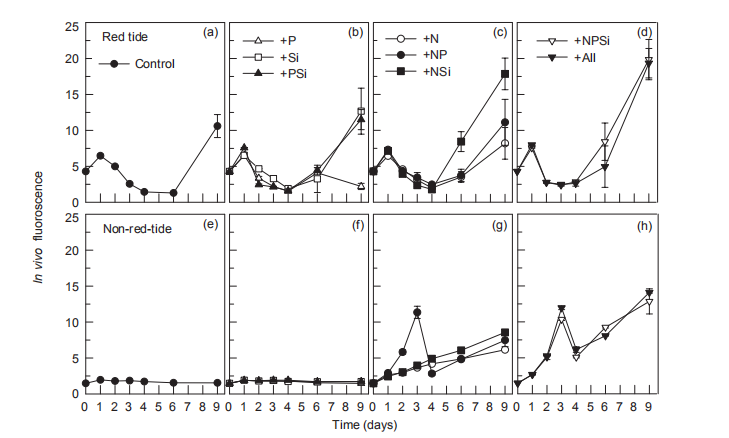
Figure 3 Time course of in vivo fluorescence for all treatments during incubation.
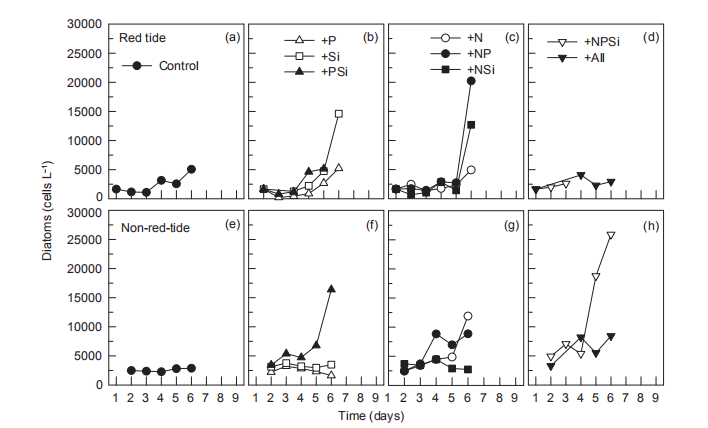
Figure 4 Time course of cell density of diatoms for all treatments during incubation.
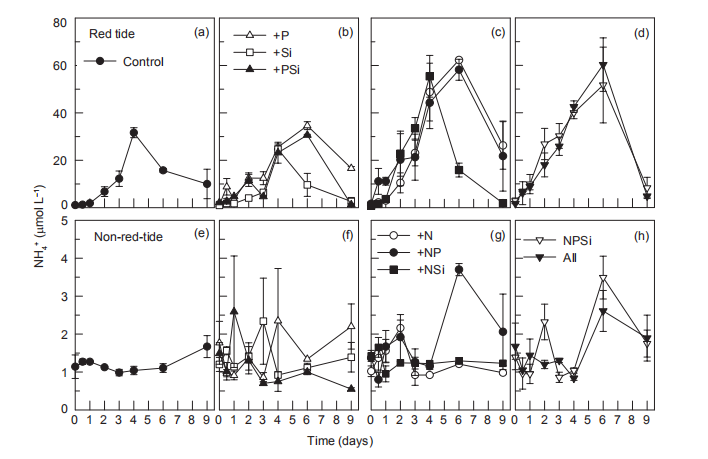
Figure 5 Time course of NH: concentrations for all treatments during incubation.
3.3.2 Uptake ofand PO^~ during incubation
In the red tide samples, the initial SiO「was ~20 卩mol L 1 and disappeared in the Control and treatments without Si additions by the end of the incubation (Figure 8). A similar amount of SiO「disappeared in the treatments with Si additions over the first 6 days and then SiO^- decreased rapidly after 6 days, with lower SiO「concentrations in the treatments with N additions than without N additions at the end of the incubation (Figure 8). In the non-red-tide samples, SiO3_ concentrations in the treatments without Si additions decreased faster than in the parallel treatments of the red tide samples and disappeared during the first 4 days. The decrease in SiO3- in the treatments with both N and Si additions was faster than that in the +Si and +PSi treatments, i.e. N additions increased the SiO「uptake (Figure 8). The time of disappearance of SiO「was earlier in the treatments of +NSi, +NPSi, and +all in the non-red-tide samples than in the red tide samples.
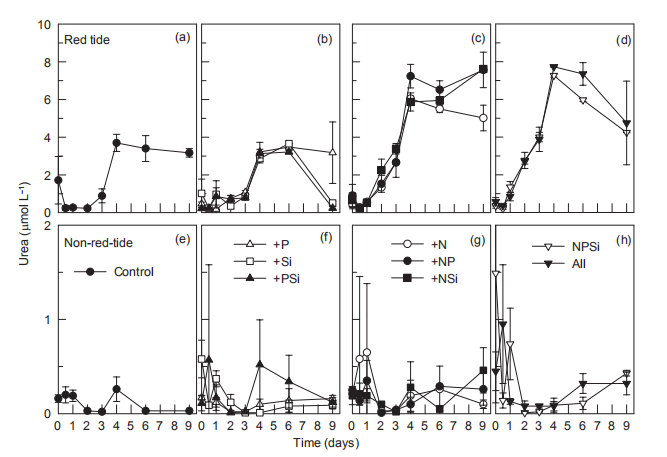
Figure 6 Time course of urea concentrations for all treatments during incubation.
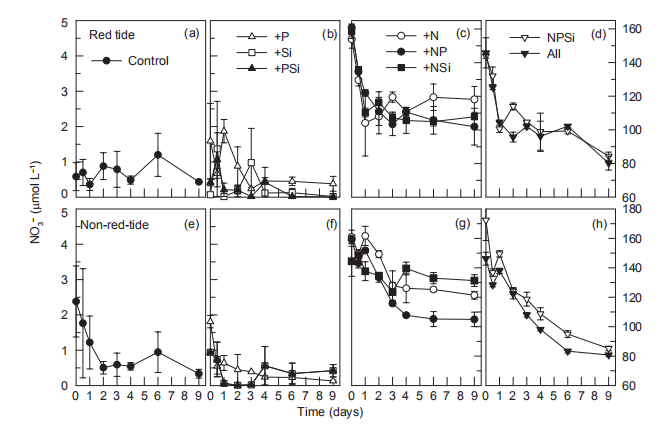
Figure 7 Time course of NO; concentrations for all treatments during incubation.
In the Control and 3 treatments without P additions, PO3_ concentrations fluctuated in the red tide samples, where PO「 increased on day 1, decreased, and then increased again on day 4. In contrast, PO「decreased and disappeared on day 4 in the 4 parallel treatments for the non-red-tide samples (Figure 9). In both the red tide and non-red tide samples,PO43 concentrations decreased markedly, and the decreases were similar between each parallel treatment with P additions (Figure 9).
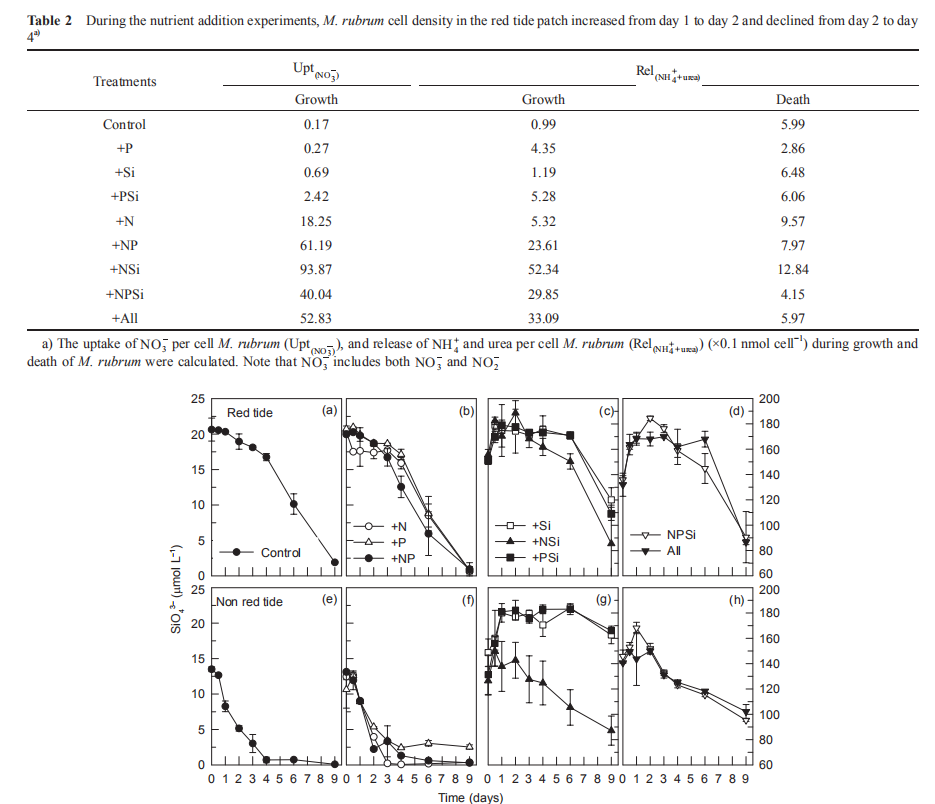
Figure 8 Time course of SiO} concentrations for all treatments during incubation.
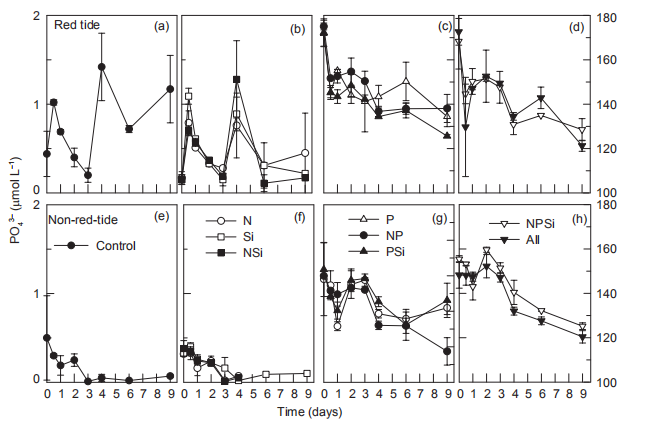
Figure 9 Time course of PO4- concentrations for all treatments during incubation.
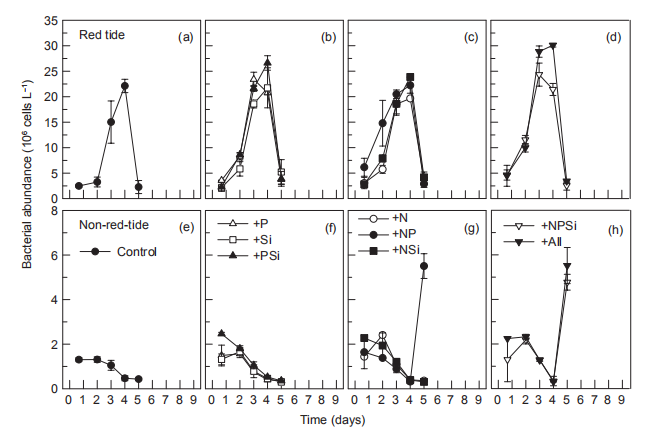
Figure 10 Time course of bacterial abundance during incubation.
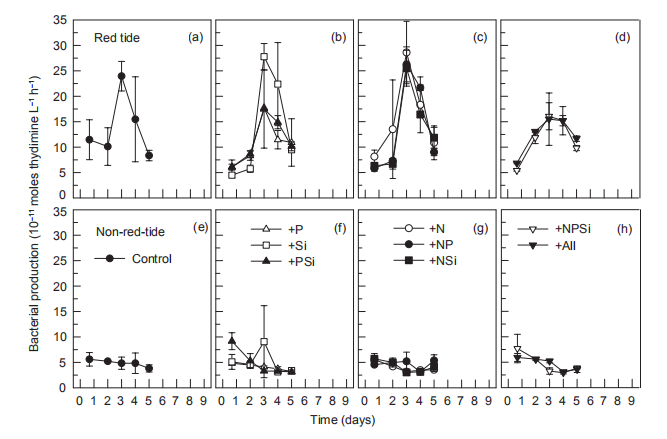
Figure 11 Time course of bacterial production during incubation.
3.4 Bacterial abundance and production
In the red tide sample, initial bacterial abundance in the Control treatment was low (<2.0x10⁶ cells L-1), rapidly increasing on day 3, reaching a maximum (2.2x10⁷ cells L-1) on day 4, and then decreasing to the initial level. In all other treatments, temporal changes in bacterial abundance exhibited a similar pattern to that of the control (Figure 10). In the non-red-tide samples, the initial bacterial abundance was similar to that of the red tide sample, and it decreased during the incubation until day 4. On day 5, bacterial abundance increased in the +NSi, NPSi, and +all treatments, but not in treatments without N addition (Figure 10). Bacterial production followed the temporal change of bacterial abundance, reaching a maximum on day 3 or 4 in the red tide samples in all treatments, but there were no peaks in the treatments of +NR +NPSi, and +all in the non-red-tide samples (Figure 11).
4. Discussion
4.1 Nutrients and phytoplankton biomass
Red tides, visible as coloured patches, are usually defined as high-biomass blooms. In general, nutrient enrichment is responsible for the increasing occurrence of red tides (Anderson et al., 2002; Glibert et al., 2005). However, in Port Shelter, one of hot spots for red tides, inorganic nutrients are low and the monthly average chl a concentration during the 10 years was less than 4 mg L-1 (Yin, 2003; Yin et al., 2008). In this study, however, chl a and the cell density of M. rubrum in the red tide patches were much higher than the local ambient nutrient could support. In addition, nutrient addition experiments demonstrated that the addition of all inorganic nutrients to a non-red-tide water sample containing low concentrations of M. rubrum did not produce cell density of M. rubrum as high as in the red tide patch, suggesting that nutrients were not an initializing factor for this red tide. Previous study also showed that initiation, maintenance, and disappearance of the dinoflagellate Scrippsiella trochoidea red tide in the bay were not directly driven by changes in nutrients (Yin et al., 2008), and the follow-up study using a high-resolution estuarine circulation model demonstrated that physical aggregation (winds and tidal currents causing flow convergence) and vertical migration of dinoflagellates promoted the formation of red tides in this low-nutrient area (Lai and Yin, 2014). The red tide of M. rubrum could have occurred through the same mechanism as modelled for the red tide of the dinoflagellate Scrippsiella trochoidea (Lai and Yin, 2014).
M. rubrum contains symbiotic algae that can carry out high photosynthetic rates and take up inorganic nutrients, based on previous bloom studies (Yih et al., 2004; Myung et al., 2013; Tong et al., 2015). In this study, lower inorganic nutrients in the red tide patch than that in non-red-tide waters suggested that the aggregated M. rubrum actively consumed nutrients.
4.2 Red tides and nutrient regeneration
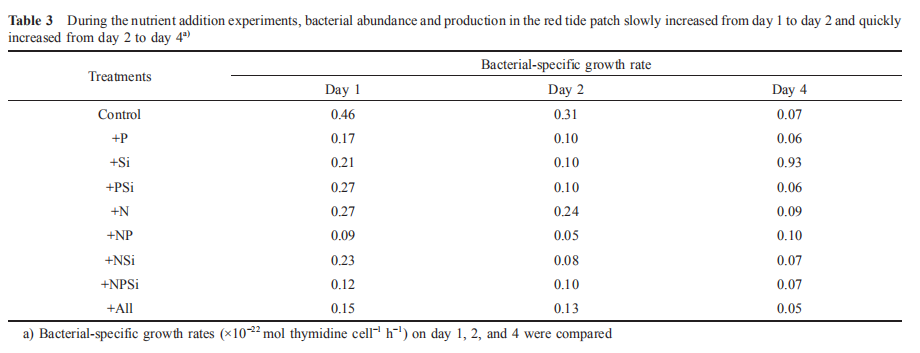
It is known that phytoplankton can release NH + by utilizing NO3 during photosynthesis. Nitrogen-replete diatoms may reduce NO; uptake and release nitrogen substrates, such as NO^, NH; or dissolved organic nitrogen, as a mechanism to dissipate light energy when the energy exceeds their im-mediate biosynthetic demand (Lomas and Glibert, 1999; Raven, 2011). Previous findings suggested that 80-90% of NO3 taken 叩 could be reduced to either NO] or NH; and subsequently released in the NO^-enriched environments (Lomas et al., 2000; Glibert et al., 2016). Furthermore, nutrition in mixotrophs is far more complex than assimilation of the major inorganic N ions (Mitra and Flynn, 2010; Flynn et al., 2013; Glibert et al., 2016). The dynamics of feeding and digestion include considerable cycling of metabolites, involving many N-assimilating enzymes, including urease, hydrolases, peptidases, and amino-transferases (Dagenais- Bellefeuille and Morse, 2013). In this study, 39~50 卩mol L-1 NO; was taken up immediately in the red tide sample with N addition by M. rubrum on day 1, indicating NH; (Figure 5) and urea (Figure 6) were released simultaneously. In addition, NH; and urea were also released from the decomposition of organic matter when the high-biomass red tide died off (Bratbak et al., 1996; Buchan et al., 2014). Therefore, the growth and demise of M. rubrum would both result in changes in NH; and urea concentrations. In this study, the uptake of NO; per M. rubrum cell varied with nutrientlevels, but the release of NH ; and urea per cell were similar under different nutrient conditions (Table 2). Furthermore, 52 16% of NO; uptake during the growth of M. rubrum was released back into the water in the N addition treatments (Table 2). This uptake might have been underestimated because of two reasons: firstly, NO] was included in the NO; measurement; secondly, other phytoplankton species, magnitudes lower, consumed N during photosynthesis when M. rubrum died. In addition, when we calculated the uptake of nitrogen by M. rubrum, the effect of bacterial growth on the concentration of nitrogen was ignored. The fact is that the maximum concentrations of nitrogen assimilated into bacterial biomass on day 2 and day 4 were approximately 1.2^10-3 and 6.0x10⁻³ 卩mol L-1, respectively, much lower than those absorbed by M. rubrum and other phytoplankton species (less than 1%). During both the growth and death of M. rubrum, bacterial-specific growth rates decreased in the red tide patch during the first 5 days (Table 3). Because the nutrient supply is a controlling factor regulating bacterial-specific growth rate (Shiah and Ducklow, 1994; Adams et al., 2010; Sinsa- baugh and Shah, 2010), bacterial growth rates varied in different treatments. Compared with the Control treatment, bacterial-specific growth rates in the nutrient addition treatments were relatively lower during the first 2 days, but similar on day 4, indicating that nutrient additions did not promote, but depressed the bacterial-specific growth rate. Previous experiments found that NH; could limit bacterial growth (Shiah and Ducklow, 1994). In this study, NH; concentrations increased in all treatments for the first 5 days. Furthermore, NH; concentration was very low for the first two days, and was much higher on day 4 in the Control treatment, whereas NH; concentrations were relatively higher in the other treatments (Figure 5). The variation in the depression of NH; may result in the various bacterial-specific growth rates in different treatments.
4.3 Plankton species succession
The increase in in vi^vo fluorescence (Figure 3) and diatom abundance (Figure 4) on days 6-9 suggested a second diatom bloom in the red tide patch, which was consistent with a remarkable decrease in SiO「during incubation (Figure 8). There were also diatom blooms in the non-red-tide patch, but they showed up earlier (on day 3). The time lag in the rapid diatom growth in the red tide patch behind that of the non- red-tide patch probably occurred because of the effect of M. rubrum on diatoms. The exact mechanisms need to be further studied. Grazing of diatoms by the ciliate was possible and high NH+, released from the collapse of red tide, could be depressive to some diatom species. NH; is the preferred form of N for phytoplankton uptake because of its lower energy requirements for the cell (Mccarthy and Goldman, 1979; Raven, 1991). Glibert et al. (2016) recently reviewed the evidence that NH; preference was grounded in the classical physiological literature and in studies where N was the limiting nutrient. However, increasing studies have confirmed NH; repression of NO; uptake and assimilation, although the repression concentration of NH; ranged from 0.1 to 10 卩mol L-1 (Wilkerson et al., 2006; Dugdale et al., 2007; Parker et al., 2012; Glibert et al., 2014). Diatoms are likely NO; opportunists, favoured under NO; enrichment (Lomas and Glibert, 1999; Donald et al., 2011, 2013), and the high concentration of NH + might inhibit the growth of diatoms in the red tide patch. These factors may result in the delayed diatom bloom in the red tide patch.
The high in vivo fluorescence and low diatom abundance in the +NPSi and +all treatments of the red tide patch indicated that other phytoplankton species were stimulated. They might be dinoflagellates or cyanobacteria, the NH; and urea lovers (Glibert, 1997; Donald et al., 2013; Glibert et al., 2016), which is consistent with the remarkable decrease in NH; (Figure 5) and urea (Figure 6) on day 9 in these treatments. In addition, nutrient addition promoted the growth of phytoplankton, particularly in the non-red-tide patch where the initial phytoplankton concentration was low, but the dominant phytoplankton species might vary. In this study, only NO; was added as an N source, which also might have influenced the phytoplankton species composition because of their different preference for different forms of N.
There was the decoupling of bacterial and phytoplankton populations both in the red tide patch and non-red-tide patch. As phytoplankton grew, bacterial abundance and production decreased, although the bacterial heterotrophic activity increased at the height of the bloom and during its decline (Figures 2 and 11). The organic matter released from the collapse of the red tide could be decomposed and remineralized to inorganic nutrients by bacteria, refuelling the second bloom (Figure 12). Therefore, bacteria played an important role in the cycling of nutrients in low-ambient nutrient water. As summarized in the conceptual framework (Figure 12), this red tide event of M. rubrum at the convergent zone of the slope region in Port Shelter occurred because ofthe aggregation ofM. rubrum, which is consistent with the low-ambient nutrient conditions; the released organic matter from the collapse of the red tide was decomposed into inorganic nutrients (N, P and Si) by bacteria, stimulating the second bloom. The released N from the red tides was mainly NH; and could regulate the phytoplankton species composition based on preferences for different N forms by phytoplankton species. This study clearly showed how a high-biomass red tide occurs in a general nutrient limiting water and how regenerated nutrients influence phytoplankton species composition.
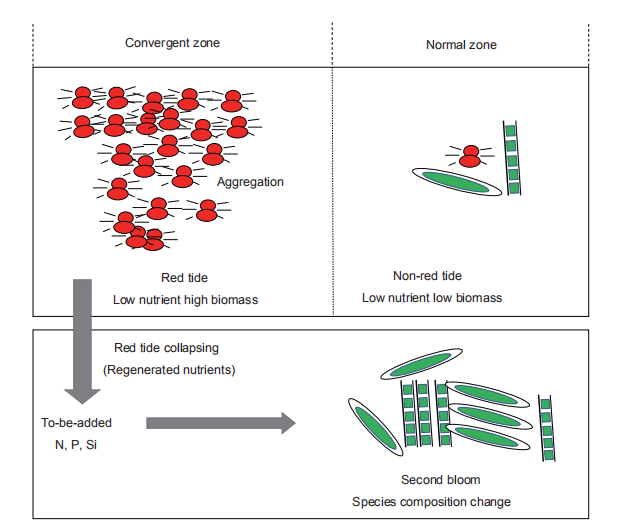
Figure 12 The conceptual framework for regeneration and utilization of nutrients during the collapse of a red tide.
5. Conclusion
Nutrient addition experiments conducted in the water samples collected from the red tide patch of M. rubrum in a low- nutrient environment verified the hypothesis that the collapse of red tides in low-ambient nutrient water released massive inorganic nutrients, and fuelled the growth of other phytoplankton species, thus, influencing the phytoplankton species composition. As the N:P ratio in the Port Shelter is lower than 16:1, the phytoplankton assemblage is potentially N limited. The released N from the red tides was mainly NH; and could regulate the phytoplankton species composition based on the preferences for different N forms by phytoplankton species. This finding has an implication: red tide events over a large scale could redistribute nutrients and influence phytoplankton species composition over a large area in the coastal waters.
Acknowledgements We acknowledge Sam Cheung and Mandy Tsoi for providing the assistance during field sampling and the nutrient addition experiments. This study was supported by the Guangdong-National Science Foundation of China (Grant Nos. U1701247) and the National Natural Science Foundation of China (Grant Nos. 91328203) and the International Science and Technology Cooperation Program of Guangdong (Grant No. 2013B051000042). Xiuxian Song was supported by the National Natural Science Foundation of China (Grant Nos. 50339040 & 40025614).
References
Adams H E, Crump B C, Kling G W. 2010. Temperature controls on aquatic bacterial production and community dynamics in arctic lakes and streams. Environ Microbiol, 12: 1319-1333
Anderson D M, Glibert P M, Burkholder J M. 2002. Harmful algal blooms and eutrophication: Nutrient sources, composition, and consequences. Estuaries, 25: 704-726
Bratbak G, Wilson W H, Heldal M. 1996. Viral control of Emiliania
huxleyi blooms? J Mar Syst, 9: 75-81
Buchan A, LeCleir G R, Gulvik C A, Gonzalez J M. 2014. Master recyclers: Features and functions of bacteria associated with phytoplankton blooms. Nat Rev Microbiol, 12: 686-698
Chrzanowski T, Kyle M. 1996. Ratios of carbon, nitrogen and phosphorus in Pseudomonas fluorescens as a model for bacterial element ratios and nutrient regeneration. Aquat Microb Ecol, 10: 115-122
Crawford D W, Purdie D A, Lockwood A P M, Weissman P. 1997. Recurrent red-tides in the southampton water estuary caused by the pho- totrophic ciliate Mesodinium rubrum. Estuar Coast Shelf Sci, 45: 799- 812
Dagenais-Bellefeuille S, Morse D. 2013. Putting the N in dinoflagellates. Front Microbiol, 4: 369
Dierssen H, McManus G B, Chlus A, Qiu D, Gao B C, Lin S. 2015. Space station image captures a red tide ciliate bloom at high spectral and spatial resolution. Proc Natl Acad Sci USA, 112: 14783-14787
Donald D B, Bogard M J, Finlay K, Bunting L, Leavitt P R. 2013. Phytoplankton-specific response to enrichment of phosphorus-rich surface waters with ammonium, nitrate, and urea. Plos One, 8: e53277-14
Donald D B, Bogard M J, Finlay K, Leavitt P R. 2011. Comparative effects of urea, ammonium, and nitrate on phytoplankton abundance, community composition, and toxicity in hypereutrophic freshwaters. Limnol Oceanogr, 56: 2161-2175
Dugdale R C, Wilkerson F P, Hogue V E, Marchi A. 2007. The role of ammonium and nitrate in spring bloom development in San Francisco Bay. Estuar Coast Shelf Sci, 73: 17-29
EPD. 2017. Marine Water Quality in Hong Kong in 2016. Monitoring Group, Water Policy and Planning Group, EPD, HKSAR
Fenchel T, Hansen P J. 2006. Motile behaviour of the bloom-forming ciliate Mesodinium rubrum. Mar Biol Res, 2: 33-40
Flynn K J, Stoecker D K, Mitra A, Raven J A, Glibert P M, Hansen P J, Graneli E, Burkholder J M. 2013. Misuse of the phytoplankton-zooplankton dichotomy: The need to assign organisms as mixotrophs within plankton functional types. J Plankton Res, 35: 3-11
Fuhrman J A, Azam F. 1982. Thymidine incorporation as a measure of heterotrophic bacterioplankton production in marine surface waters: Evaluation and field results. Mar Biol, 66: 109-120
Fukuda R, Ogawa H, Nagata T, Koike I. 1998. Direct determination of carbon and nitrogen contents of natural bacterial assemblages in marine environments. Appl Environ Microbiol, 64: 3352-3358
Glibert P M. 1997. Interactions of top-down and bottom-up control in planktonic nitrogen cycling. Hydrobiologia, 363: 1-12
Glibert P, Seitzinger S, Heil C, Burkholder J A, Parrow M, Codispoti L, Kelly V. 2005. The role of eutrophication in the global proliferation of harmful algal blooms. Oceanography, 18: 198-209
Glibert P M, Wilkerson F P, Dugdale R C, Parker A E, Alexander J, Blaser S, Murasko S. 2014. Phytoplankton communities from San Francisco Bay Delta respond differently to oxidized and reduced nitrogen sub- strates—Even under conditions that would otherwise suggest nitrogen sufficiency. Front Mar Sci, 1: 1-16
Glibert P M, Wilkerson F P, Dugdale R C, Raven J A, Dupont C L, Leavitt P R, Parker A E, Burkholder J A M, Kana T M. 2016. Pluses and minuses of ammonium and nitrate uptake and assimilation by phytoplankton and implications for productivity and community composition, with emphasis on nitrogen-enriched conditions. Limnol Oceanogr, 61: 165-197
Gustafson D E, Stoecker D K, Johnson M D, Van Heukelem W F, Sneider K. 2000. Cryptophyte algae are robbed of their organelles by the marine ciliate Mesodinium rubrum. Nature, 405: 1049-1052
Herfort L, Peterson T D, Prahl F G, McCue L A, Needoba J A, Crump B C, Roegner G C, Campbell V, Zuber P. 2012. Red waters of Myrionecta rubra are biogeochemical hotspots for the columbia river estuary with impacts on primary/secondary productions and nutrient cycles. Estuar Coast, 35: 878-891
Huang C, Qi Y. 1997. The abundance cycle and influence factors on red tide phenomena of Noctiluca scintillans (Dinophyceae) in Dapeng Bay, the South China Sea. J Plankton Res, 19: 303-318
Jiang H, Johnson M D. 2017. Jumping and overcoming diffusion limitation of nutrient uptake in the photosynthetic ciliate Mesodinium rubrum. Limnol Oceanogr, 62: 421-436
Knap A H, Michaels A, Close A R, Ducklow H, Dickson A G. 1996. Protocols for the joint global ocean flux study (JGOFS) core measurements. JGOFS, Reprint of the IOC Manuals and Guides No. 29, UNESCO 1994, 19
Lai Z, Yin K. 2014. Physical-biological coupling induced aggregation mechanism for the formation of high biomass red tides in low nutrient waters. Harmful Algae, 31: 66-75
Liu H, Song X, Huang L, Tan Y, Zhang J. 2011. Phytoplankton biomass and production in northern South China Sea during summer: Influenced by Pearl River discharge and coastal upwelling. Acta Ecologica Sin, 31: 133-136
Lomas M W, Glibert P M. 1999. Temperature regulation of nitrate uptake: A novel hypothesis about nitrate uptake and reduction in cool-water diatoms. Limnol Oceanogr, 44: 556-572
Lomas M W, Rumbley C J, Glibert P M. 2000. Ammonium release by nitrogen sufficient diatoms in response to rapid increases in irradiance. J Plankton Res, 22: 2351-2366
Mccarthy J J, Goldman J C. 1979. Nitrogenous nutrition of marine phytoplankton in nutrient-depleted waters. Science, 203: 670-672
Mitra A, Flynn K J. 2010. Modelling mixotrophy in harmful algal blooms: More or less the sum of the parts? J Mar Syst, 83: 158-169
Myung G, Kim H S, Park J W, Park J S, Yih W. 2013. Sequestered plastids in Mesodinium rubrum are functionally active up to 80 days of pho- totrophic growth without cryptomonad prey. Harmful Algae, 27: 82-87
Parker A E, Hogue V E, Wilkerson F P, Dugdale R C. 2012. The effect of inorganic nitrogen speciation on primary production in the San Francisco Estuary. Estuar Coast Shelf Sci, 104-105: 91-101
Porter K G, Feig Y S. 1980. The use of DAPI for identifying and counting aquatic microflora1. Limnol Oceanogr, 25: 943-948
Price N M, Harrison P J. 1987. Comparison of methods for the analysis of dissolved urea in seawater. Mar Biol, 94: 307-317
Raven J A. 1991. Physiology of inorganic C acquisition and implications for resource use efficiency by marine phytoplankton: Relation to increased CO2 and temperature. Plant Cell Environ, 14: 779-794
Raven J A. 2011. The cost of photoinhibition. Physiologia Plantarum, 142: 87-104
Saba G K, Steinberg D K, Bronk D A, Place A R. 2011. The effects of harmful algal species and food concentration on zooplankton grazer production of dissolved organic matter and inorganic nutrients. Harmful Algae, 10: 291-303
Shiah F K, Ducklow H W. 1994. Temperature and substrate regulation of bacterial abundance, production and specific growth rate in Chesapeake Bay, USA. Mar Ecol Prog Ser, 103: 297-308
Sinsabaugh R L, Shah J J F. 2010. Integrating resource utilization and temperature in metabolic scaling of riverine bacterial production. Ecology, 91: 1455-1465
Slawyk G, Macisaac J J. 1972. Comparison of two automated ammonium methods in a region of coastal upwelling. Deep Sea Res Oceanogr Abstr, 19: 521-524
Tong M, Smith J L, Kulis D M, Anderson D M. 2015. Role of dissolved nitrate and phosphate in isolates of Mesodinium rubrum and toxinproducing Dinophysis acuminata. Aquat Microb Ecol, 75: 169-185
Vrede K, Heldal M, Norland S, Bratbak G. 2002. Elemental composition (C, N, P) and cell volume of exponentially growing and nutrient-limited bacterioplankton. Appl Environ Microbiol, 68: 2965-2971
Wilkerson F P, Dugdale R C, Hogue V E, Marchi A. 2006. Phytoplankton blooms and nitrogen productivity in San Francisco Bay. Estuar Coast, 29: 401-416
Yih W, Kim H S, Jeong H J, Myung G, Kim Y G. 2004. Ingestion of cryptophyte cells by the marine photosynthetic ciliate Mesodinium rubrum. Aquat Microb Ecol, 36: 165-170
Yih W, Kim H S, Myung G, Park J W, Yoo Y D, Jeong H J. 2013. The red- tide ciliate Mesodinium rubrum in Korean coastal waters. Harmful Algae, 30: S53-S61
Yin K. 2003. Influence of monsoons and oceanographic processes on red tides in Hong Kong waters. Mar Ecol Prog Ser, 262: 27-41
Yin K, Song X X, Liu S, Kan J, Qian P Y. 2008. Is inorganic nutrient enrichment a driving force for the formation of red tides? Harmful Algae, 8: 54-59
(Responsible editor: Rui ZHANG)