

Modelling marine DOC degradation time scales
Luca Polimene1,*, Richard B. Rivkin2, Ya-Wei Luo3, Eun Young Kwon4, Marion Gehlen5, M. Angelica Pena6, Nannan Wang3, Yantao Liang7, Hermanni Kaartokallio8 and Nianzhi Jiao3
INTRODUCTION
Marine dissolved organic carbon (DOC) is formed of a large number of highly diverse molecules. Depending on the environmental conditions, a fraction of these molecules may become progressively resistant to bacterial degradation and accumulate in the ocean for extended time scales. This long- lived DOC (the so-called recalcitrant DOC, RDOC) is thought to play an important role in the global carbon cycle by sequestering carbon into the ocean interior and potentially affecting the climate. Despite this, RDOC formation is underrepresented in climate models. Here we propose a model formulation describing DOC recalcitrance through two state variables: one representing the bulk DOC concentration and the other representing its degradability (k ) which varies depending on the balance between the production of 'new' DOC (assumed to be easily degradable) and bacterial DOC utilization assumed to leave behind more recalcitrant DOC. We propose this formulation as a means to include RDOC dynamics into climate model simulations.
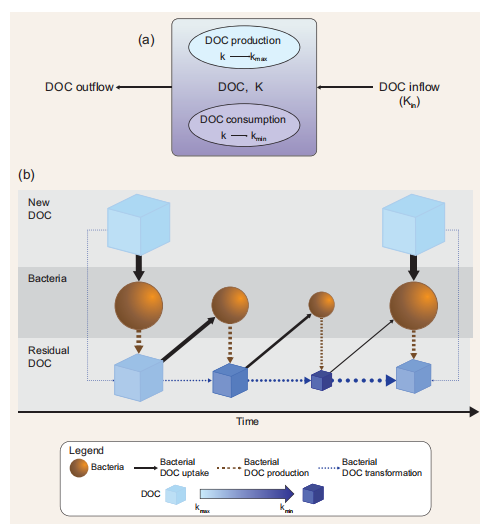
Figure 1. (a) Schematic representation of the model. DOC is the DOC concentration inside the box model; k is the DOC degradation function (see the main text for further explanation); DOC production is the DOC that is newly produced through primary production or other food web processes; DOC consumption is the DOC that is assimilated by bacteria. DOC production increases the value of k towards kmax while DOC consumption decreases the value of k towards kg. The DOC transported inside the box(inflow) influences k depending on the degradation function associated with the incoming DOC and on the magnitude of the flux (Equation 2.3, Table 1). Transported DOC can be expressed as an external forcing function ifthe model is used in a ‘standalone' mode(e.g.the example reported inthis paper) orthroughadvective and/ordiffusive fluxes from adjacent boxes ifa1Dor3D physical models are used. The export of DOC outside the box (outflow) does not affect k insidethe box model. DOC has a concentration unit (e.g. mass per unit volume orarea)while kisdimensionless. (b) Model functioning. Light-blue boxes indicatefreshly produced, semi-labile DOC (i.e. with k =Kq The degree of recalcitrance is represented by increasingly dark-blue colour. The interactions between bacteria and fresh DOC produce residual DOC with lower k. If the production of new DOC stops, DOC is biochemically altered and transformed andthevalue of k progressively decreases approaching k^n.Ifthe production offresh DOC starts again (or if fresh DOC is transported), k increases proportionally to the amount of the new DOC biologically produced and/or physically transported relative to the initial concentration of DOC (standing stock). Boxes and spheres represent pools (concentrations) while arrows indicate fluxes. Arrow widths represent the magnitude of the flux relative to the DOC pool.
Assessing the capacity of the ocean to store atmospheric CO2 is one of the major challenges for oceanographers. Several physical and biological mechanisms have been proposed to 'pump' CO2 from the surface to the ocean interior, thus storing carbon for extended time frames [1,2]. Some of these mechanisms are driven by physical processes (i.e. the solubilitypump) while others are the results of the interactions between biology (primary production, particle formation, prey-predators interactions) and physics (gravitational sinking, mixing, convection). The latter processes have collectively been termed the ‘Biological Carbon Pump'. The recently proposed Microbial Carbon Pump (MCP) provides an additional carbon sequestration mechanism primarily due to biological drivers [3]. Indeed,the main process underpinning the MCP is the bacterially mediated transformation of labile (i.e. rapidly degradable) dissolved organic carbon (DOC) into recalcitrant (i.e. slowly degradable) DOC (RDOC), which may accumulate into the ocean at time scales ranging from months to millennia, in this latter case sequestering atmospheric CO2 into stable long-lived organic molecules [4]. The production of RDOC is not directly affected by physical processes (mixing, sinking or thermohaline circulation) and its production is depth-independent一that is, it is active through the entire water column[2]. However, abiotic forcing such as vertical mixing and photo-degradation may also affect the RDOC fate and its spatial distribution, thus influencing the strength and the efficiency of the MCP.
Being the latest recognized mechanism of ocean carbon sequestration, the MCP is also the least well investigated and represented in marine ecosystem models. Generally, DOC is modelled by using up to three state variables, with each of them characterized by a constant degradation time scale [5]. This approach is not consistent with the prevailing idea that the recalcitrance of DOC is an environmentally dependent property[3]emerging from the repeated transformation and selective use of the labile organic carbon substrates by bacteria [6]. Some models have explicitly described the bacterially mediated transformation of DOC into RDOC; however, these studies do not consider the long- lasting fractions of RDOC and are not able to simulate RDOC accumulation on time scales that are longer than seasonal [7].
One of the main challenges with modelling DOC accumulation beyond the seasonal time scale is representing the turnover time of the various pools of RDOC that is formed of a large number of highly diverse molecules with a continuum spectrum of degradation rates [4]. Explicitly modelling such a wide diversity would end up in an unmanageable number of state variables,
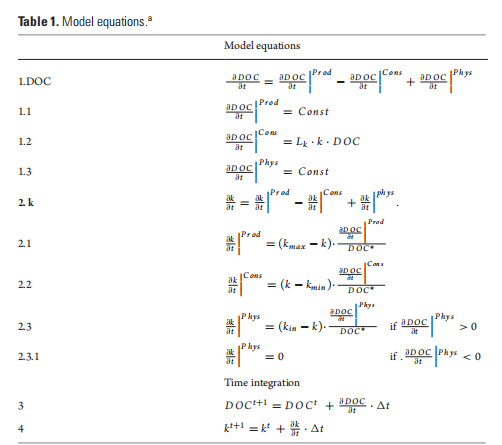
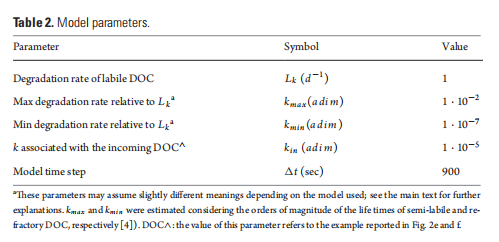
The equations presented in this table refer to the simplified example reported in this paper (Figs 2 and 3), which assumes constant production ofDOC, implicit bacterial uptake and a constant transport ofDOC. However, the proposed lormu- lations describing DOC degradability (k) are also meant to be implemented in more complex models that have DOC production, consumption and physical transport represented by more complex equations. *DOC concentration in the box model (Fig. 1a) is assumed to be always >0.
We propose to model transformations of the DOC pools (Fig. 1 and Table 1) using one state variable representing the bulk DOC concentration and a degradation function k(t). The use of a degradation function can have two different meanings. Depending on the model formulation, k can be (i) a function regulating the affinity of bacteria for a substrate, if bacteria biomass and DOC uptake are modelled explicitly [7], or (ii) a bulk rate constant representing DOC consumption in a model without explicit parameterization of the heterotrophic bacterial transformations ofDOC [8]. In both cases, k describes the stability (i.e. resistance to degradation) of a one form ofDOC (i.e. RDOC) with respect to another form of DOC (i.e. labile DOC) and ranges from a minimum (i.e. kmi n) to a maximum (i.e. kmax) value. High k values imply high affinity by the bacteria for DOC or high consumption rate, while low k values indicate low affinity or low consumption rate. To give an example, a k(t) = 0.01 means that, at time t, RDOC is 100 times less susceptible to bacterial degradation (i.e. more stable) than labile DOC. While the degradation scale of labile DOC (assumed to be 1 d—1) is used as reference in our formulation (see the parameter Lk in Equation 1.2 in Table 1), we set the upper limit of the degradation function kmax to a lower value as our formulation is specifically designed to assess DOC degradation at time scales much longer than daily (i.e. from years to longer). Consequently, kmax has a value of 0.01, implying a DOC consumption rate of 100 days. It should be also stressed that, in this paper, we assume that bacteria dominate environmental DOC degradation and transformations; consequently, k represents only the biologically mediated DOC consumption and transformation. However, -DdOC |C nc (Fig. 1, Equation 1.2) may also include abiotic processes in future model implementation. To explain model functioning and assumptions, we use a simple box model characterized by a concentration X of DOC with an associated degradation value equal to k(t ) (Fig. 1a).
This model can be either considered as a standalone box model or as a spatial unit (i.e. a subunit of a larger model grid) of a 3D domain. In this latter case, k will be dependent on space (x) and time (t) [i.e. k = k(t, x)]. DOC produced inside the box through primary production has associated degradation that is equal to kmax. This is consistent with previous findings suggesting that most of the DOC that is freshly produced by phytoplankton is degraded by bacteria within tens of days [9]. As a first approximation, here we do not consider other food web processes (e.g. grazing), which are also known to produce DOC [10]. However, the term  〕Prod (Equation 1.1) may also include other DOC sources in future model implementation. The value of k inside the box model is affected by the newly produced DOC proportionally to the increase in DOC and the difference between k and kmax (Equation 2.1 in Table 1). Bacterial activity alters the DOC molecular structure and composition by removing specific components (i.e. chemical reactive groups or compounds or parts of them) and leaving behind biochemically altered material that becomes progressively more recalcitrant [6]. The residual DOC fraction resulting from the DOC-bacteria degradation function k(t). The use of a degradation function can have two different meanings. Depending on the model formulation, k can be (i) a function regulating the affinity of bacteria for a substrate, if bacteria biomass and DOC uptake are modelled explicitly [7], or (ii) a bulk rate constant representing DOC consumption in a model without explicit parameterization of the heterotrophic bacterial transformations ofDOC [8]. In both cases, k describes the stability (i.e. resistance to degradation) of a one form ofDOC (i.e. RDOC) with respect to another form of DOC (i.e. labile DOC) and ranges from a minimum (i.e. kmi n) to a maximum (i.e. kmax) value. High k values imply high affinity by the bacteria for DOC or high consumption rate, while low k values indicate low affinity or low consumption rate. To give an example, a k(t) = 0.01 means that, at time t, RDOC is 100 times less susceptible to bacterial degradation (i.e. more stable) than labile DOC. While the degradation scale of labile DOC (assumed to be 1 d—1) is used as reference in our formulation (see the parameter Lk in Equation 1.2 in Table 1), we set the upper limit of the degradation function kmax to a lower value as our formulation is specifically designed to assess DOC degradation at time scales much longer than daily (i.e. from years to longer). Consequently, kmax has a value of 0.01, implying a DOC consumption rate of 100 days. It should be also stressed that, in this paper, we assume that bacteria dominate environmental DOC degradation and transformations; consequently, k represents only the biologically mediated DOC consumption and transformation. However, -DdOC |C nc (Fig. 1, Equation 1.2) may also include abiotic processes in future model implementation. To explain model functioning and assumptions, we use a simple box model characterized by a concentration X of DOC with an associated degradation value equal to k(t ) (Fig. 1a).
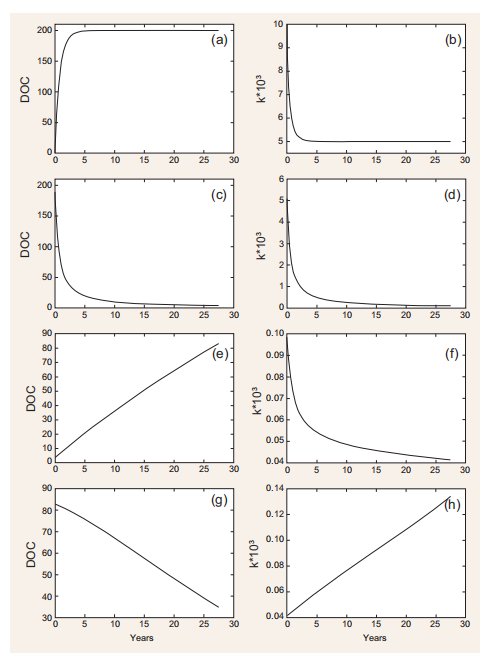
Figure 2. Model simulations. (a) and (b) Starting from low initial concentration (1 mg C m-3) and a constant production rate of new DOC (1 mg C m-3 d-1), the DOC concentration increases until reaching a steady state (i.e. consumption = production). Starting from a kvalue of 0x, the modelled value of k exponentially decreases as a result of DOC utilization by bacteria (Equation 2.2 in Table 1)until a steady state is reached. (c) and (d) If DOC production stops, the DOC pool decreases with a decrease in k. (e) and (f) If allochthonous DOC with a kn that is similar to the local value of k is mixed with the DOC inside the box model, the (combined) DOC accumulates, while k continues to decrease due to bacterial DOC consumption(Equation 2.2 in Table 1). (g) and (h) When there is a slow production (0.001 mg C m-3 d-1)of fresh DOC (i.e. with k =Kq orfresh allochthonous DOC is transported inside the box
This model can be either considered as a standalone box model or as a spatial unit (i.e. a subunit of a larger model grid) of a 3D domain. In this latter case, k will be dependent on space (x) and time (t) [i.e. k = k(t, x)]. DOC produced inside the box through primary production has associated degradation that is equal to kmax. This is consistent with previous findings suggesting that most of the DOC that is freshly produced by phytoplankton is degraded by bacteria within tens of days [9]. As a first approximation, here we do not consider other food web processes (e.g. grazing), which are also known to produce DOC [10]. However, the term 〕Prod (Equation 1.1) may also include other DOC sources in future model implementation. The value of k inside the box model is affected by the newly produced DOC proportionally to the increase in DOC and the difference between k and kmax (Equation 2.1 in Table 1). Bacterial activity alters the DOC molecular structure and composition by removing specific components (i.e. chemical reactive groups or compounds or parts of them) and leaving behind biochemically altered material that becomes progressively more recalcitrant [6]. The residual DOC fraction resulting from the DOC-bacteria interactions also includes compounds derived from bacterial metabolism that are resistant to fast degradation [6]. Here, we thus assume that, every time DOC is assimilated/consumed, the remaining organic fraction becomes less biologically available (i.e. more degraded) and its degradation time scales increase with k approaching kmi n. The decrease in k mimics the increased degradation state of DOC following bacteria utilization [6] and is dependent on the decrease in DOC concentration inside the box and on the difference between k and kmin (Fig. 1 and Table 1).
Ocean circulation and vertical turbulent mixing strongly affect DOC distributions. For example, DOC can be laterally transported or mixed within the water column [11]. Consequently, k is also affected by physical transportation of DOC. The DOC inflow into the box model implies a change in the local k (i.e. inside the box) value dependent on the degradability associated with the incoming DOC (k;n ) and proportional to the magnitude of the DOC flux into the box (Fig. 1; Equation 2.3 in Table 1). If k;n < k, k will decrease; if k;n > k, k will increase. DOC outflow does not affect the value of k associated with the remaining DOC. It should be noted that our model does not explicitly represent the effect of environmental factors, such as temperature and nutrients, or grazer- and viral-mediate mortality on phytoplankton and bacterial processes. These effects, which potentially impact both DOC production and consumption [10], are routinely described in plankton models, and are therefore meant to be accounted for by the modelling framework in which the proposed formulation is implemented.
An example of how DOC and its associated degradation characteristics are dynamically modelled as a function ofDOC production and consumption is given in Fig. 2. Under specific assumptions (see figure caption), the model can accumulate relatively labile DOC (i.e. k ~10-3; Fig. 2a and b), generate a small amount of long-lasting DOC (k ~10-4, Fig. 2c and d), accumulate DOC increasingly resistant to degradation (k~10-5, Fig. 2e and f) and degrade RDOC when fresh, labile DOC is produced or added to the system (Fig. 2g and h). This latter feature, mimicking the so-called ‘priming effect' [12], is further explored in the simulations reported in Fig. 3. The rate of input of labile DOC (through production or transport) regulates both the rate of consumption of recalcitrant DOC initially present and its degradability. The consumption and degradability of recalcitrant DOC increase with the production of fresh DOC. More specifically, the model predicts that the time required for degrading half of the initial stock of DOC decreases from~50to ~5 years if the production of fresh DOC increases from 1 - 10-S to S - 10-2mg Cm-3 d-1. It needs to be stressed that this relationship and the patterns displayed in Fig. 2 are, at this stage of development, purely conceptual examples, as a quantitative validation against experimentaldata is still to be performed. Despite this, however, and although performed in a highly simplified theoretical frame, model simulations reproduce key aspects related to the MCP, such as (i) the coupling between DOC production and consumption observed in highly productive areas such as estuaries [13]; (ii) the decrease in DOC degradability when primary production is reduced or absent, as for example in the deep ocean [4]; and (iii) the increase in DOC degradability following the addition of freshly produced DOC [12].
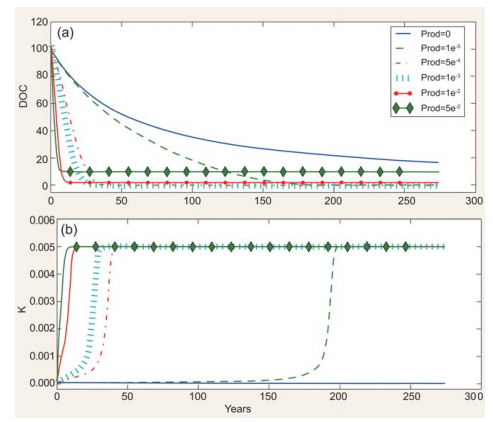
Figure 3. Effect of fresh DOC on recalcitrant DOC consumption. (a) Consumption of ‘old' DOC (i.e. DOC with initial k = 5 -10-5 )atdifferent production rates [prod(mg C m-3 d-1)] of ‘new' DOC(i.e. DOC with K = kmaJ.(b) kdynamics at different production rates of ‘new' DOC.
TOWARDSMODELLINGTHE MCP
The general absence of RDOC and its dynamics in (most) marine ecosystem models may reflect the assumptions that the contribution of marine biota to global carbon sequestration is mainly through the biological carbon pump and that the majority of RDOC reacts at time scales (millennia) exceeding those investigated with current ecosystem and climate models. However, since the MCP is a ubiquitous process in the ocean, even small alterations in its functioning due to climate change could impact on global biogeochemical cycles on much smaller timescales [2,3]. For example, the projected increase in sea-water temperature, thermal stratification, mid-latitude olig- otrophication, ocean acidification and increase in riverine discharge of both dissolved organic matter and nutrients are all factors expected to change the MCP- mediated RDOC production [3]. However, the amplitude and the direction (positive or negative) of the feedback are highly uncertain at this stage of understanding. For this reason, we are proposing a simple model that can be used to investigate these potentially important processes with a hypothesis-testing approach. The formulationwe propose (Table 1) is computationally 'light' and can be applied to represent slowly degradable DOC in models with different complexity, including large-scale models that do not explicitly include bacteria. The next step in the development of ourmodel will be to implement the formulation into a simple 3D ocean biogeochemistry model to assess whether the simulated variability of k is consistent, at global scales, with known properties of the DOC pool (e.g. k should be smaller in the deep layers where RDOC is dominant [4]). Furthermore, by comparing DOC simulation with existing large datasets [10], it will be possible to evaluate whether the proposed kmin and kmax values (Table 2) provide the best fit with observed DOC.
Concomitantly with large-scale simulations, process-oriented experiments should be executed to evaluate whether the bacterially mediated transformation of the DOC pool simulated by the model (through the variability of k, Fig. 2) is quantitatively realistic. Mechanisms regulating DOC production from primary production are well investigated and constrained, and a set of established models is present in the literature [10]. As a consequence, DOC production ( d|Proid, in model equation, Table 1) can be represented in different ways, from simple empirical relationships [11] to more mechanistic, physiologically- based formulations [7]. In contrast tothe relatively well-known processes leading to the production ofDOC by the marine food web, the bacterially mediated biochemical transformation of DOC and the controlling factors that lead to the formation of RDOC are still largely unknown. For example, although some studies suggest that RDOC formation through the MCP can be enhanced by low inorganic nutrient concentrations [3], quantitative relationships between inorganic nutrient availability to bacteria and the production of RDOC still need to be established. This limited observation makes the modelled relationship between DOC consumption (|国 in Table 1) and DOC degradability (represented by k) highly uncertain and thus a challenge to incorporate into models.
The understanding of the mechanisms underpinning RDOC formation and accumulation has so far been limited by the difficulty in characterizing and quantitatively measuring RDOC (i.e. on a chemical structure basis). Although we are still far from a complete chemical characterization of RDOC, in recent years, state-of-the-art mass spectrometry techniques have allowd the identification of specific combinations of elements (in terms of C:H and C:O ratios) and molecular masses that characterize RDOC [15]. Such a ‘chemical fingerprint' allows RDOC to be recognized in bacterial cultures and is observed to be produced ubiquitously by bacteria in remarkably short time frames (e.g. months [16]). Controlled, ad hoc performed experiments exploiting these techniques and specifically addressing microbial RDOC production starting fromlabile substrates (under different environmental conditions, e.g. temperature and nutrient concentrations) are required to iteratively calibrate, validate and refineour model. In addition to traditional, laboratory-based experiments, in the near future, model development will also benefit from newly designed studies performed with large-volume facilities [17] that may strategically combine the advantage of a controlled system with the realism of the dynamics observed within them. Only after a rigorous, experimentally based validation can our model be used for reliable (quantitative) prediction of MCP dynamics. Although the model is at an early stage of development, we propose that it is a means to include RDOC dynamics into climate model simulations. Such simulations will represent a powerful hypothesis-testing tool to complement experimental and field studies in the investigation of the role played by the MCP in ocean carbon sequestration in past, present and future oceans.
ACKNOWLEDGEMENTS
The authors thank the organizers of the Yanqi Lake conference(Beijing, September2017)in which this workwas conceived. The authors also acknowledge one anonymous reviewer for her/his useful comments and suggestions and DawnAshby (PML) for her help in drawing Fig. 1.
FUNDING
L.P. was funded through the (UK) NERC national capability in sustained observation and marine modelling and through the UK Earth System Model project (NE/N018036/1). Funds from the Natural Sciences and Engineering Research Council of Canada and the President's International Fellowship Initiative of the Chinese Academy of Sciences (CAS PIFI 2016VTA038) partially supported RB.R. Y.-W. L. was funded by National KeyR&D Programof China 2016YFA0601404 and NSFC grant 41476093. NSFC project 41606153 supported Y.L. E.Y.K is funded by IBS-R028- D1 and NRF-2016R1D1A1B04931356. NJ. was funded by Chinese projects GASI-03-01-02-05 and NSFC 91751207, 91428308.
Luca Polimene1,*, Richard B. Rivkin2, Ya-Wei Luo3, Eun Young Kwon4, Marion Gehlen5, M. Angelica Pena6, Nannan Wang3, Yantao Liang7, Hermanni Kaartokallio8 and Nianzhi Jiao3
1 Plymouth Marine Laboratory, Prospect Place, UK department of Ocean Sciences, Memorial University of Newfoundland, Canada 3State Key Laboratory of Marine Environmental Science, College of Ocean and Earth Sciences, Xiamen University, China 4Centerfor Climate Physics, Institute for Basic Science, South Korea 5Laboratoire des Sciences du Climat et de l'Environnement, Institut Pierre Simon Laplace, CEA-CNRS-UVSQ, France 6Institute of Ocean Sciences, Fisheries and Oceans Canada, Canada 7Key Laboratory of Biofuels, Shandong Provincial Key Laboratory of Energy Genetics, Qingdao Institute of Bioenergy and Bioprocess Technology, Chinese Academy of Sciences, China 8Finnish Environment Institute, Marine Research Centre, Finland
* Corresponding author.
E-mail: luca@pml.ac.uk
REFERENCES
1.Volk T and Hoffert MI. Ocean carbon pumps: analysis of relative strength and efficiencies of in ocean-driven circulation atmospheric CO2 changes. In: Sundquist ETand BroeckerWS (eds). The Carbon Cycle and Atmospheric CO2: Natural VariationArchean to Present. Washington, DC: American Geophysical UnionAGU Monograph 32, 1985,321-37.
2.Legendre L, Rivkin RB and Weinbauer MG etal. NatCommun 2015; 134: 432-50.
3.Jiao N, Robinson C and Azam F et al. Biogeosciences 2014; 11: 5285-306.
4.Hansell DA. AnnRevMarSci2013; 5: 421-45.
5.Anderson TR, Christian JR and Flynn KJ. Modeling DOM biogeochemistry. In: Hansell DA and Carlson CA (eds). BiogeochemistryofMarine Dissolved Organic Matter. Burlington US: Elsevier, 2015, 635-67.
6.Benner R and Amon RMW. Annu Rev Mar Sci 2015; 7:185-205.
7.Polimene L, Sailley S and Clark D et al. J Plank Res 2017; 39:180-6.
8.Letscher RT, Moore JK and Primeau F. Biogeosciences 2015; 12: 209-21.
9.Polimene L, Clark D and Kimmance S et al. PLoS
ONE2017; doi: 10.1371/journal.pone.0171391.
10.Carlson CA and Hansell DA. DOM sources, sinks, reactivity, and budget. biogeochemistry. In: Hansell DA and Carlson CA (eds). Biogeochemistry ofMarine Dissolved Organic Matter. Burlington US: Elsevier, 2015,66-94.
11.Hansell DA, Carlson CA and Repeta DJ et al. Oceanography 2009; 22: 202-11.
12.Guenet B, Danger M and Abbadie L etal. Ecology 2010; 91:2850-61.
13.Jiao N, Tang Kand Cai H etal. NatRevMicrobiol 2011; 9: 75.
14.Jiao N, Cai Rand Zheng Q etal. NatlSciRev 2018; 5: 459-63.
15.Hertkorn N, Benner R and Frommberger M et al. Geochim Cosmochim Acta 2006; 70: 2990- 3010.
16.Osterholz H, Niggemann J and Giebel HA et al. Nature Commun 2015; 6: 7422.
17.Legendre L, Rivkin RBand Jiao N. ICES J Mar Sci 2017; doi:10.1093/icesjms/fsx146.
National Science Review
5: 468-474, 2018
doi: 10.1093/nsr/nwy066
Advance access publication 19 June 2018